
- Title
-
Assessing the Ameliorative Effect of Selenium Cinnamomum verum, Origanum majorana, and Origanum vulgare Nanoparticles in Diabetic Zebrafish (Danio rerio)
- Authors
- Pérez Gutiérrez, R.M., Soto Contreras, J.G., Martínez Jerónimo, F.F., de la Luz Corea Téllez, M., Borja-Urby, R.
- Source
- Full text @ Plants (Basel)
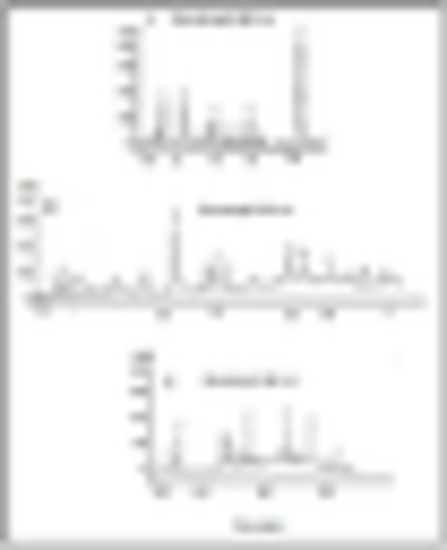
Figure 1. HPLC chromatogram of phenolic compounds of the hydroalcoholic extract. (A) Cinnamomum zeylanicum: (1) protocatechuic acid; (2) coumarin; (3) cinnamic acid; (4) vanillic acid; (5) p-coumaric acid; (6) caffeic acid; (7) rosmaric acid; (8) eugenol; (9) cinnamaldehyde. (B) Origanum majorana: (1) chlorogenic acid; (2) gallic acid; (3) pyrogallol; (4) resorcinol; (5) cinnamic acid; (6) carnosic acid; (7) syringic acid; (8) p-coumaric acid; (9) caffeic acid; (10) rosmarinic acid; (11) eugenol; (12) ferulic acid. (C) Origanum vulgare: (1) chlorogenic acid; (2) gentisic acid; (3) chicoric acid; (4) salvianolic acid B; (5) rosmarinic acid; (6) ferulic acid.
|
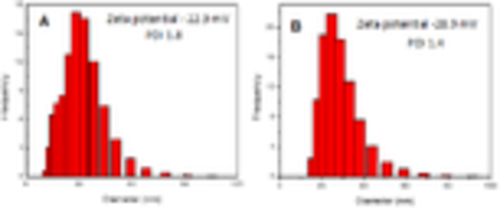
Figure 2. (A) Size distribution of SeNPs. (B) Size distribution of GA-COO-SeNPs. |
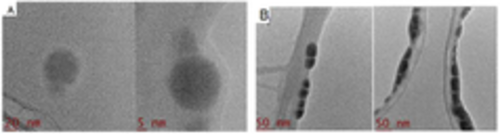
Figure 3. High-resolution transmission electron microscopy (TEM) images of SeNPs at 20 and 5 nm. (A) SeNPs derived from the COO depicting spherical nanoparticles (B) with bar scales of 20 and 10 nm.
|
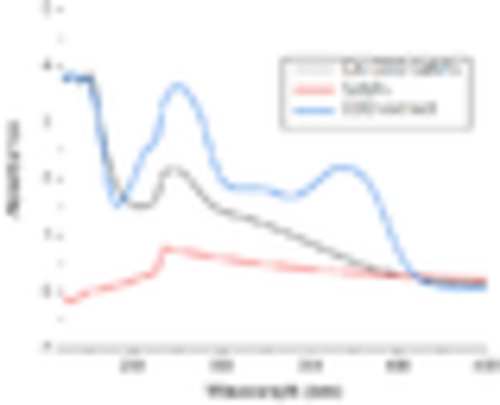
Figure 4. UV–Vis spectra of GA-COO-SeNPs, SeNPs, and COO extract.
|

Figure 5. FTIR spectra of GA, H2Se2O3, COO, and GA-COO-SeNPs.
|

Figure 6. Photographs of GA-COO-SeNPs over 175 days period of storage. The left sample was taken immediately after synthesis (day 0). |

Figure 7. Release profiles of COO extract from GA-COO-SeNPs at various pH levels (5.5, 7.4, and 9.0). |

Figure 8. EDX analyses of COO extract (A) and GA-COO-SeNPs (B). |

Figure 9. (A) Effect of NPs on the survival rates of zebrafish. The activity levels of antioxidant enzymes in the liver of zebrafish were experimentally induced to a diabetic condition, with and without NPs, (B) catalase (CAT), (C) superoxide dismutase (SOD), and (D) glutathione peroxidase (GPx). The green color indicates day 0, while yellow indicates day 14 after starting the experiment with a daily dose of 20 µg/L of a sample. Significant differences compared to the diabetic group: * p < 0.001; ** p < 0.01; *** p > 0.05.
|