
- Title
-
Transcriptome-wide subtyping of pediatric and adult T cell acute lymphoblastic leukemia in an international study of 707 cases
- Authors
- Dai, Y.T., Zhang, F., Fang, H., Li, J.F., Lu, G., Jiang, L., Chen, B., Mao, D.D., Liu, Y.F., Wang, J., Peng, L.J., Feng, C., Chen, H.F., Mu, J.X., Zhang, Q.L., Wang, H., Ariffin, H., Moy, T.A., Wang, J.H., Lou, Y.J., Chen, S.N., Wang, Q., Liu, H., Shan, Z., Matsumura, I., Miyazaki, Y., Yasuda, T., Dou, L.P., Yan, X.J., Yan, J.S., Yeoh, A.E., Wu, D.P., Kiyoi, H., Hayakawa, F., Jin, J., Wang, S.Y., Sun, X.J., Mi, J.Q., Chen, Z., Huang, J.Y., Chen, S.J.
- Source
- Full text @ Proc. Natl. Acad. Sci. USA
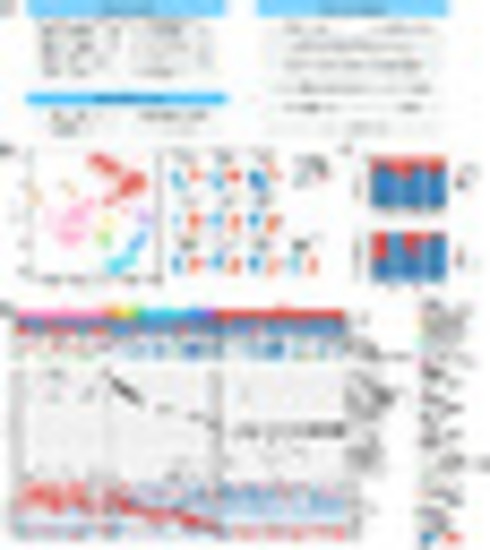
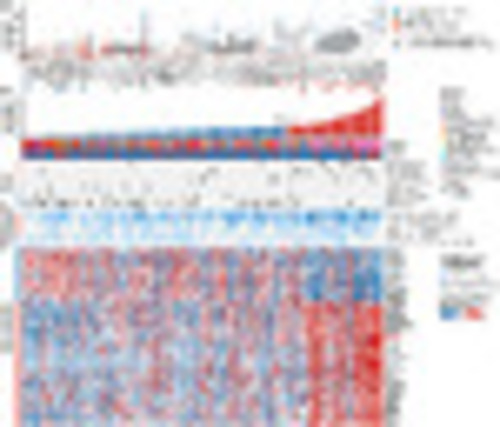
Overview of molecular subtypes of T-ALL. (A) Overview of the T-ALL study workflow. RNA-seq data of T-ALL patients from eight cohorts are collected and integrated. After quality control, the gene-expression profile, sequence variations, and gene fusions identified from RNA-seq data are subjected to further analysis. tSNE analysis and hierarchical clustering methods are applied to determine the subtypes of T-ALL. (B) Two-dimensional tSNE plot and suprahexagonal map of 707 T-ALL patients. On the tSNE plot, each dot represents one T-ALL patient. The top 5% of genes demonstrating variance (with a perplexity score of 15 and a θ-value of 0.2) are subjected to tSNE analysis. Patient samples are colored according to the subtypes. Shown, Right, are illustrations of subtype-specific expression using a suprahexagonal map. (C) Bar plot of the percentage of patients based on age and gender in each subtype. (D) Profiling of clinical characteristics and genetic features identified in 707 T-ALL patients. Columns indicate T-ALL patients, and rows represent three panels: clinical information panel (subtypes, age, gender, clinical outcome, ETP status, T-cell maturation stage), fusion panel (gene fusions, including fusions reported in the original study from public cohorts and identified in RNA-seq), and expression panel (gene-expression level of dysregulated leukemic factors). Patient samples are ordered according to the unsupervised hierarchical clustering within each subtype. For the gene-expression panel, up- and down-regulated genes are shown in the heatmap in red and blue, respectively. Ten subtypes are defined according to their molecular features: G1 (LYL1/LMO2 overexpression, LYL1/LMO2), G2 (GATA-3 mutation, GATA-3 mut), G3 (SPI1-fusion, SPI1-fus), G4 (KMT2A-rearrangement, KMT2A-r), G5 (MLLT10-rearrangement, MLLT10-r), G6 (HOXA10-fusion, HOXA10-fus), G7 (TLX3 overexpression probably due to fusion to TCR, TLX3), G8 (TLX1 overexpression probably due to fusion to TCR, TLX1), G9 (NKX2-1 overexpression, NKX2-1), and G10 (TAL1/LMO1 overexpression, TAL1/LMO1). |
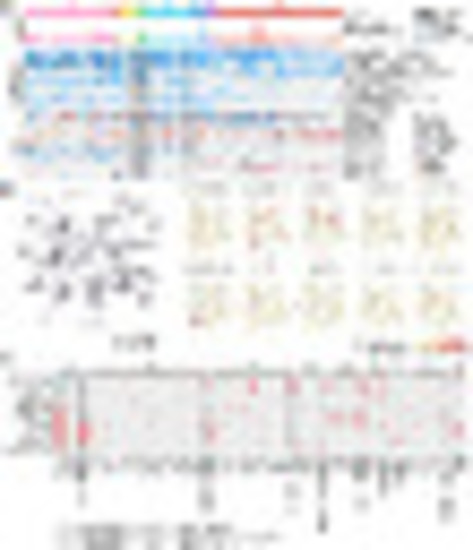
The landscape of molecular interaction and pairwise relationship between nonsilent gene mutations. (A) Profiling of nonsilent gene mutations identified in 707 T-ALL RNA-seq. Mutation counts, gene mutations with high frequencies, and mutations in different categories are illustrated in three panels. In the Top, the number of mutations identified in RNA-seq data are illustrated as a barplot. In the Middle, genes with over 10% mutation frequency in T-ALL, as well as USP7 (9.5%) and GATA3 (used to discriminate GATA-mut subtype), are visualized. In the Bottom, mutation events in different categories are summarized using a blue label. (B, Left) Network visualization of mutated genes with edges defined by the knowledge of gene interactions from KEGG pathways. (Right) The same network but with nodes color-coded by the subtype-specific mutation frequency. (C) Comparison of the percentage of mutations in each subtype. Tendencies of cooccurrence and independence/exclusivity between gene mutations and subtypes are calculated, respectively. Red pies represent statistically significant cooccurrence, blue ones indicate statistically significant exclusivity, while gray ones show tendencies of gene mutation relationship that does not reach to statistical significance. Statistical significance of cooccurrence and exclusivity is calculated by comparing the mutations frequency in this subtype with other subtypes using χ2 test (when cases in all conditions >5) or Fisher’s exact test. Due to the limited sample sizes in some subtypes, some tendencies of relationship between gene mutations and subtypes could not always reach to statistical significance. Statistical results between mutations and subtypes are listed in Dataset S6. |
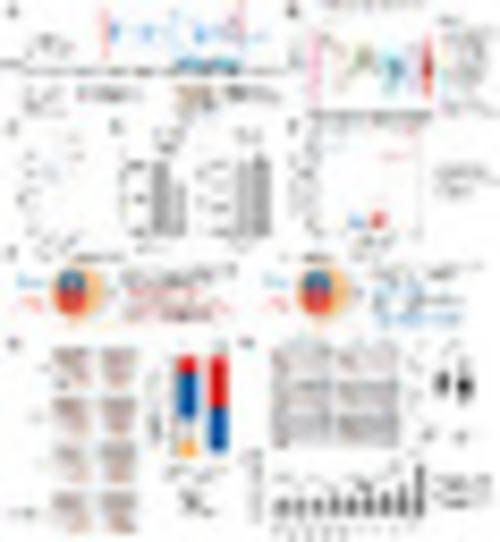
Schematic representation of GATA3 point mutations. (A) Protein structure of GATA3 and its mutations in T-ALL. All mutations on GATA3 are visualized on the upper area of the protein structure, and mutations in the N-finger domain identified in G2 are visualized in the lower area. (B) Boxplot of gene expression of GATA3 in each subtype. The dashed line represents the mean value of GATA3 in 707 T-ALLs. The P values are calculated by comparing with the mean gene expression of GATA3 using Wilcoxon rank-sum test. (C) Boxplot of count of GATA3WT and altered GATA3MUT reads in G2. P value is calculated using paired Wilcoxon rank-sum test. (D) Binding free energy (KJ/mol) reveals binding affinities of GATA3 (wild type, R276Q) protein and wrapping and bridging DNA sequence. (E) Volcano plot shows the differentially expressed genes between G2 (GATA3-mut) and GATA3WT T-ALL. Each dot represents one gene. Genes significantly up-regulated in G2 (GATA3-mut) are colored in red, and significantly down-regulated in G2 (GATA3-mut) in blue. (F, Left) Gene-expression level of predicted bridging genes in T-ALL patients with different GATA3 genotypes; (Right) the gene ontology results using up-regulated bridging genes in GATA3R276Q. (G) WISH results of rag1 RNA probes between GATA3WT- and GATA3R276Q-mRNA injected embryos at 4 dpf. The phenotypes are defined as four groups: high, normal, mild, and extremely low according to the rag1 RNA+ area in thymus. The percent is quantified (Right). P value is calculated using Fisher’s exact test. (H) WISH results of cmyb, αe-globin, and lyz RNA probes between GATA3WT- and GATA3R276Q -injected embryos at 4 dpf. P value is calculated using Wilcoxon rank-sum test. (I) qRT-PCR analysis of mRNA expression of the GATA3 downstream genes and rag1 in both GATA3WT- and GATA3R276Q-mRNA injected embryos at 4 dpf. The relative mRNA expressions are normalized to human GATA3. P values are calculated using Student's t test. |
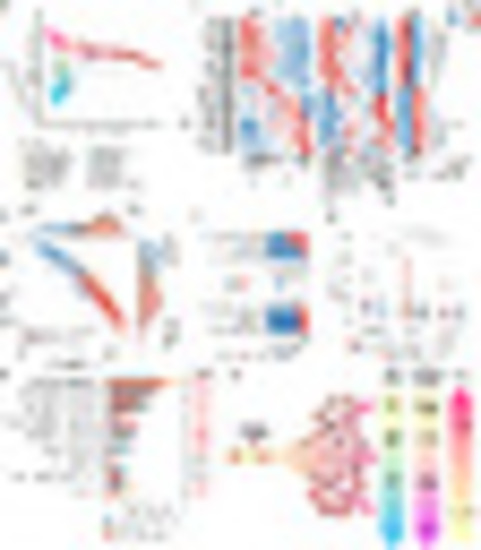
Dimensionality reduction analysis revealing T cell development in different subtypes. (A) Visualization of the dimensions calculated by diffusion map using 707 T-ALL patients. The top 5% variance genes in RNA-seq data are subjected to diffusion map analysis and the first three diffusion components are visualized using three-dimensional plots. Each point represents one sample. (B) Gene-expression patterns of signatures of different functional clusters. These clusters were differentially expressed in different T cell stages. The Left heatmap shows the expression levels of functional clusters in different T cell stages, the Middle heatmap shows the expression levels in different subtypes, while the Right heatmap shows the expression levels in different branches. Expression is calculated using the mean value of the genes and then scaled as the row z-score. (C) Scatter and density plot of enrichment score (ES) for ETP and precortical signatures in different dysregulated leukemogenic factor branches. (D) Bar plot of the percentage of patients according to age (Upper) and gender (Lower) in each dysregulated leukemogenic factor branch. P values are calculated using a χ2 test. (E) Violin plot of mutation counts identified in RNA-seq of each branch. The outline color represents age information and the internal boxplot represents the three branches. P values are calculated using Wilcoxon rank-sum test. (F) Comparisons of different functional categories of mutations in the three branches. P values are calculated using Fisher’s exact test. (G) Model of the association between the accumulation of genetic abnormalities, the dysregulation of leukemogenic factors, T cell stages, and age in T-ALL leukemogenesis. |
Profiling of genetic abnormalities in pediatric and adult T-ALL. (A) Boxplot of age distribution of mutated genes (>2%) in T-ALL. Patient samples are colored based on the three dysregulated leukemogenic factor branches. Genes are ordered according to the mean age of patients. Mutations significantly enriched in adult T-ALL are marked with red stars, while those significantly enriched in pediatric T-ALL are marked with blue stars. P value is calculated using Fisher’s exact test. (B) Profiling of gene fusions, mutation categories, and vulnerable pathways for potential therapeutic targets in pediatric and adult T-ALL. Columns indicate T-ALL patients, and rows represent four panels: clinical information panel (age, subtypes, gender), fusion panel (gene fusions, only P < 0.05 between pediatric and adult patients were illustrated), mutation counts in categories (P < 0.05), and gene-expression panel (potential therapeutic targets significantly correlated with age, false-discovery rate < 0.05). The gene-expression levels are normalized by z-score transformation. |
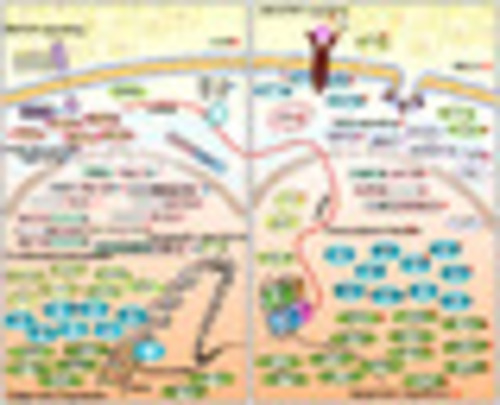
Schematic presentation of gene-expression alterations and gene lesions identified in T-ALL. (Left) Genomic aberrations in pediatric T-ALL, and (Right) illustration of those in adult T-ALL. Gene fusions and mutations (>1%) and their subcellular localizations from cell surface membrane through cytosolic compartments to cell nucleus are represented. Mutations are illustrated in the ellipse and in different colors. Fusions and mutations that are significantly enriched in pediatric T-ALL are marked with blue stars, while those significantly enriched in adult T-ALL are marked with red stars. Genes whose overexpression is most likely due to fusions are marked with red arrows. LCK and BCL2 overexpression may represent drug targets and are labeled with arrowheads. |