
- Title
-
Coagulation Factor IIIa (f3a) Knockdown in Zebrafish Leads to Defective Angiogenesis and Mild Bleeding Phenotype
- Authors
- Subramaniam, S., Liu, J., Fletcher, C., Ramchandran, R., Weiler, H.
- Source
- Full text @ Front Cell Dev Biol
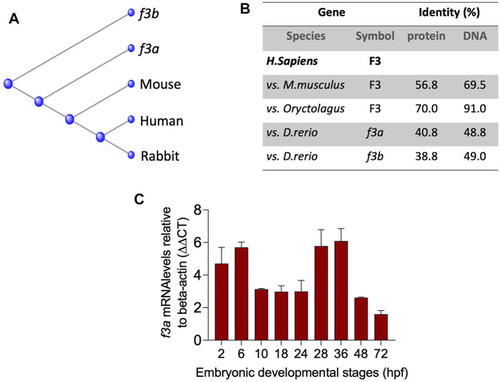
Evolutionary relationships and Spatiotemporal expression of Zebrafish TF- EXPRESSION / LABELING:
|
|
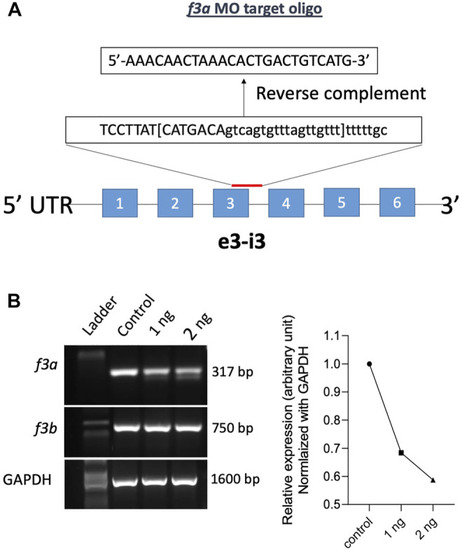
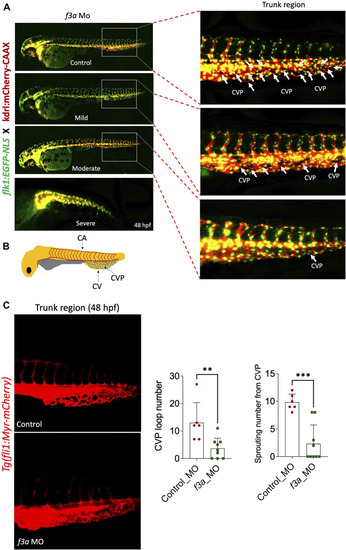
MO-mediated knockdown of PHENOTYPE:
|
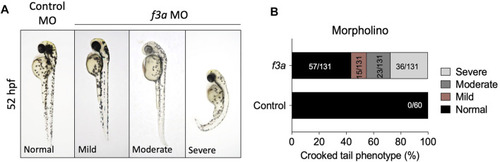
PHENOTYPE:
|
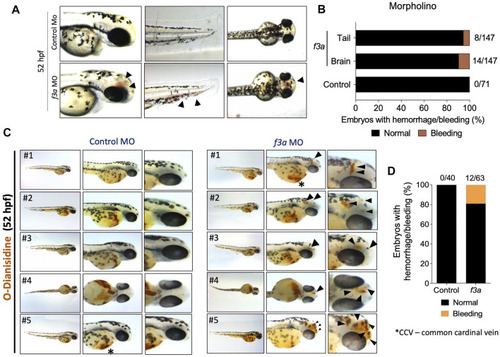
PHENOTYPE:
|