FIGURE SUMMARY
Title

Intravitreal Administration of rhNGF Enhances Regenerative Processes in a Zebrafish Model of Retinal Degeneration

Authors
Cocchiaro, P., Di Donato, V., Rubbini, D., Mastropasqua, R., Allegretti, M., Mantelli, F., Aramini, A., Brandolini, L.
Source
Full text @ Front Pharmacol

ngfrb and ntrk1 mRNA expression pattern in adult zebrafish eye. (A) Schematic representation of the zebrafish retina with nuclear and plexiform layers highlighted. (B)In situ hybridization (ISH) for ngfrb expression in cross sections of adult zebrafish retina (signal in blue/violet). (C) High magnification showing the expression of ngfrb gene in the different retinal layers and cell types. (D) ISH for ntrk1 expression in adult zebrafish retina (signal in blue/violet). (E) High magnification showing ntrk1 transcript localization in the different retinal layers and cell types. RPE: retinal pigmented epithelium. ONL: outer nuclear layer. OPL: outer plexiform layer. INL: inner nuclear layer. IPL: inner plexiform layer. GCL: ganglion cell layer. Scale bar: 50 μm.

Light-induced retinal degeneration zebrafish model. (A,B) Representative images of retinal cryosections of adult zebrafish eyes immunostained with Zpr1 antibody (red), which labels photoreceptor cells, and stained with DAPI (blue), which labels nuclei. (A) Retinal cryosection of adult zebrafish eye not exposed to constant light (NO LID). (B) Retinal cryosection of adult zebrafish eye exposed to 60 h of constant light (light-induced degeneration—LID). (C) Quantification of ONL thickness (number of retinae analyzed = 12). (D) Quantification of ONL cell number (number of retinae analyzed = 12, total number of cells: 305 for injured and 1,243 for control retinae). (E,F) Representative images of retinal cryosections of adult zebrafish eyes stained with TUNEL (red), which labels apoptotic cells, and with DAPI (blue), which labels nuclei. (E) Retinal cryosection of adult zebrafish eye not damaged by light exposure (NO LID). (F) Retinal cryosection of adult zebrafish eye after 60 h of LID. (G) Quantification of TUNEL-positive cells shown as mean number per retina (number of retinae analyzed = 12). Data are shown as means ± SEM. ***p < 0.001 (Mann–Whitney test). Scale bar: 50 μm.

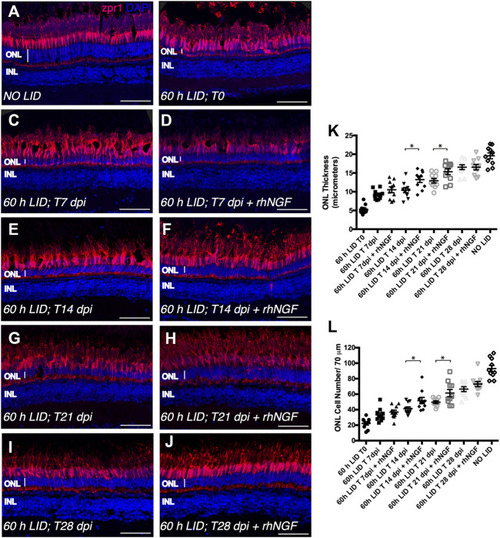
FIGURE 3. Analysis of rhNGF-induced retinal tissue recovery upon light-induced degeneration (LID). (A–J) Representative images of retinal cryosection of adult zebrafish eyes immunostained for Zpr1 antibody (red) and stained with DAPI (blue). (A) Retinal cryosection of an adult zebrafish eye not exposed to light. (B) Retinal cryosection of an adult zebrafish eye exposed to 60 h of LID at T = 0 (N animals:10; N total cells: 223). (C) Cryosection of an untreated adult zebrafish retina at 7 dpi (N animals:10; N total cells: 332). (D) Retinal cryosection of rhNGF-injected adult zebrafish eye at 7 dpi (N animals:10; N total cells: 369). (E) Cryosection of an untreated adult zebrafish retina at 14 dpi (N animals:10; N total cells: 412). (F) Retinal cryosection of rhNGF-injected adult zebrafish eye at 14 dpi (N animals:10; N total cells: 518). (G) Cryosection of an untreated adult zebrafish retina at 21 dpi (N animals:10; N total cells: 498). (H) Retinal cryosection of rhNGF-injected adult zebrafish eye at 21 dpi (N animals:10; N total cells: 614). (I) Cryosection of an untreated adult zebrafish retina at 28 dpi (N animals:10; N total cells: 665).(J) Retinal cryosection of rhNGF-injected adult zebrafish eye at 28 dpi (N animals:10; N total cells: 731). (K) Quantification of ONL thickness in the different conditions. Data are shown as means ± SEM: *p < 0.05 (one-way ANOVA test followed by a Sidak’s multiple comparison test); 60 h LID T 14 dpi vs. 60 h LID T 14 dpi + rhNGF: Adjusted p-value: 0.0108; 60 h LID T 21 dpi vs. 60 h LID T 21 dpi + rhNGF: Adjusted p-value: 0.0394. (L) Quantification of ONL cell number in the different conditions. Data are shown as means ± SEM: *p < 0.05 (one-way ANOVA test followed by a Sidak’s multiple comparison test); 60 h LID T 14 dpi vs. 60 h LID T 14 dpi + rhNGF: Adjusted p-value: 0.0424; 60 h LID T 21 dpi vs. 60 h LID T 21 dpi + rhNGF: Adjusted p-value: 0.0240. DPI: days post injury. Scale bar: 50 μm.

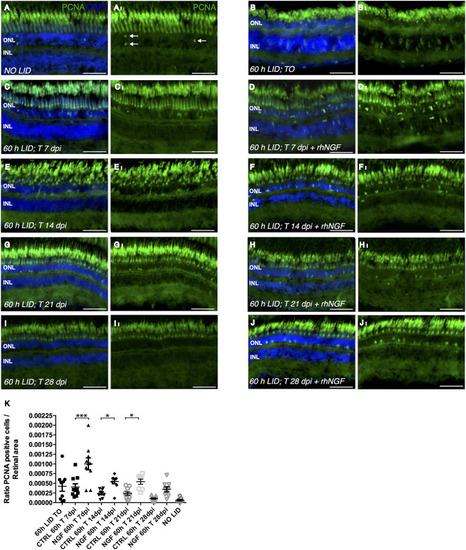
Analysis of rhNGF-induced cell proliferation upon light-induced degeneration (LID). (A–J) Representative images of retinal cryosection of adult zebrafish eyes immunostained with anti-PCNA antibody, which labels proliferating cells (green), and stained with DAPI (blue). (AI–JI) Images extrapolated from A–J displaying exclusively the PCNA signal. (A,A)I Retinal cryosection of an adult zebrafish eye not exposed to light (N retinae: 9). (B,BI) Retinal cryosection of adult zebrafish eye exposed to 60 h of LID (N retinae: 9). (C,CI) Cryosection of untreated adult zebrafish retina at 7 dpi (N retinae: 10). (D,DI) Retinal cryosection of rhNGF-injected adult zebrafish eye at 7 dpi (N retinae: 10). (E,EI). Cryosection of untreated adult zebrafish retina at 14 dpi (N retinae: 9). (F,FI) Retinal cryosection of rhNGF-injected adult zebrafish eye at 14 dpi (N retinae: 9). (G,GI) Cryosection of untreated adult zebrafish retina at 21 dpi (N retinae: 10).(H,HI) Retinal cryosection of rhNGF-injected adult zebrafish eye at 21 dpi (N retinae: 8). (I,II) Cryosection of untreated adult zebrafish retina at 28 dpi (N retinae: 9). (J,JI) Retinal cryosection of untreated rhNGF-injected adult zebrafish eye at 28 dpi (N retinae: 9).(K) Quantification of proliferating cells. Ratio of PCNA-positive cells over the analyzed area is shown. Data are shown as means ± SEM (n = 10). ***p < 0.001; **p < 0.01; *p < 0.05 (one-way ANOVA test followed by a Sidak’s multiple comparison test); 0 h LID T 7 dpi vs. 60 h LID T 7 dpi + rhNGF: Adjusted p-value:< 0.001; 60 h LID T 14 dpi vs. 60 h LID T 14 dpi + rhNGF: Adjusted p-value: 0.0379; 60 h LID T 21 dpi vs. 60 h LID T 21 dpi + rhNGF: Adjusted p-value: 0.0412. DPI: days post injury. Scale bar: 50 μm.

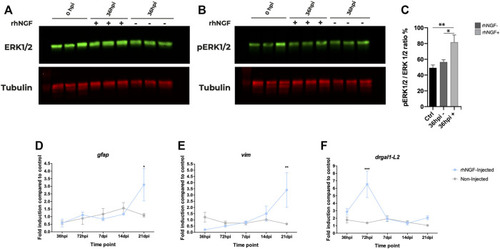
rhNGF-mediated pathway activation and gene expression in adult zebrafish during retinal regeneration. (A, B) Western blot analysis of ERK during retinal regeneration. (A) Total ERK protein levels in non-injected and rhNGF-injected adult zebrafish eyes at 0 h post injury (hpi) and at 36 hpi. Ctr-0 hpi (N: 15 eyes); 36 hpi rhNGF − (N: nine eyes); 36 hpi rhNGF + (N: 9 eyes) (3 eyes × time point × condition). (B) Phosphorylated ERK protein levels in the same samples analyzed in A. (C) Bar plot of pERK/ERK ratio as normalized fluorescence intensity relative to protein levels. Data are shown as means and standard error of the mean (SEM). The statistical analysis test used was one-way ANOVA followed by a Dunnett’s multiple comparisons test; 0 hpi vs. 36 hpi rhNGF +: Adjusted p-value: 0.0078; 36 hpi un-injected N: nine eyes; 36 hpi rhNGF − vs. 36 hpi rhNGF +: Adjusted p-value: 0.0347. (D–F). Expression levels of Müller glia-specific genes gfap, vim, and drgal1-L2 during retinal regeneration (N three eyes time point condition). Data are shown as mean ± SEM. ***p < 0.001; **p < 0.01; *p < 0.05 (two-way ANOVA test followed by a Sidak’s multiple comparisons test). gfap: 21 dpi un-injected vs. 21 dpi rhNGF-injected. Adjusted p-value: 0.0134; vim: 21 dpi un-injected vs. 21 dpi rhNGF-injected: Adjusted p-value: 0.0052. drgaI: 72 hpi un-injected vs. 72 hpi rhNGF-injected: Adjusted p-value: <0.001. rhNGF: recombinant human nerve growth factor.

Acknowledgments
This image is the copyrighted work of the attributed author or publisher, and ZFIN has permission only to display this image to its users. Additional permissions should be obtained from the applicable author or publisher of the image. Full text @ Front Pharmacol