
|
FIGURE 3
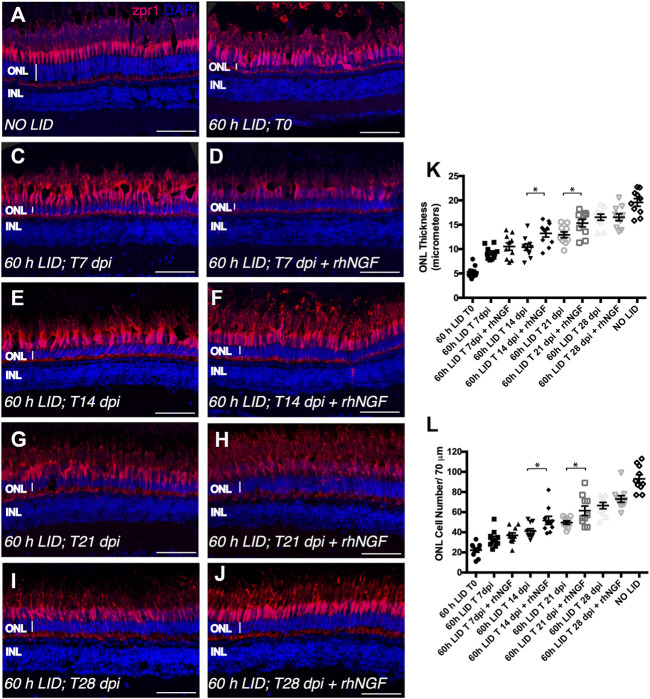
FIGURE 3. Analysis of rhNGF-induced retinal tissue recovery upon light-induced degeneration (LID). (A–J) Representative images of retinal cryosection of adult zebrafish eyes immunostained for Zpr1 antibody (red) and stained with DAPI (blue). (A) Retinal cryosection of an adult zebrafish eye not exposed to light. (B) Retinal cryosection of an adult zebrafish eye exposed to 60 h of LID at T = 0 (N animals:10; N total cells: 223). (C) Cryosection of an untreated adult zebrafish retina at 7 dpi (N animals:10; N total cells: 332). (D) Retinal cryosection of rhNGF-injected adult zebrafish eye at 7 dpi (N animals:10; N total cells: 369). (E) Cryosection of an untreated adult zebrafish retina at 14 dpi (N animals:10; N total cells: 412). (F) Retinal cryosection of rhNGF-injected adult zebrafish eye at 14 dpi (N animals:10; N total cells: 518). (G) Cryosection of an untreated adult zebrafish retina at 21 dpi (N animals:10; N total cells: 498). (H) Retinal cryosection of rhNGF-injected adult zebrafish eye at 21 dpi (N animals:10; N total cells: 614). (I) Cryosection of an untreated adult zebrafish retina at 28 dpi (N animals:10; N total cells: 665).(J) Retinal cryosection of rhNGF-injected adult zebrafish eye at 28 dpi (N animals:10; N total cells: 731). (K) Quantification of ONL thickness in the different conditions. Data are shown as means ± SEM: *p < 0.05 (one-way ANOVA test followed by a Sidak’s multiple comparison test); 60 h LID T 14 dpi vs. 60 h LID T 14 dpi + rhNGF: Adjusted p-value: 0.0108; 60 h LID T 21 dpi vs. 60 h LID T 21 dpi + rhNGF: Adjusted p-value: 0.0394. (L) Quantification of ONL cell number in the different conditions. Data are shown as means ± SEM: *p < 0.05 (one-way ANOVA test followed by a Sidak’s multiple comparison test); 60 h LID T 14 dpi vs. 60 h LID T 14 dpi + rhNGF: Adjusted p-value: 0.0424; 60 h LID T 21 dpi vs. 60 h LID T 21 dpi + rhNGF: Adjusted p-value: 0.0240. DPI: days post injury. Scale bar: 50 μm.