
- Title
-
Concurrent Evaluation of Mortality and Behavioral Responses: A Fast and Efficient Testing Approach for High-Throughput Chemical Hazard Identification
- Authors
- Thunga, P., Truong, L., Tanguay, R.L., Reif, D.M.
- Source
- Full text @ Front Toxicol

Kernel density plot of Aggregate entropies (AggE) of 1060 ToxCast chemicals before and after removing mortality information. The density histogram plots AggE on the horizontal axis. The red line represents the distribution of AggE for chemicals obtained by summarizing information from all Super Endpoints (all SE) and the blue line represents AggE of chemicals after excluding data from mortality endpoint. |
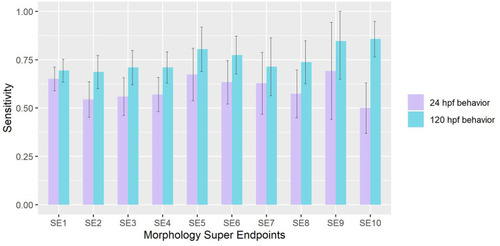
Sensitivity of 24 hpf and 120 hpf behavior in detecting chemicals that affect each morphological super endpoint. Error bars represent 95% confidence intervals. |
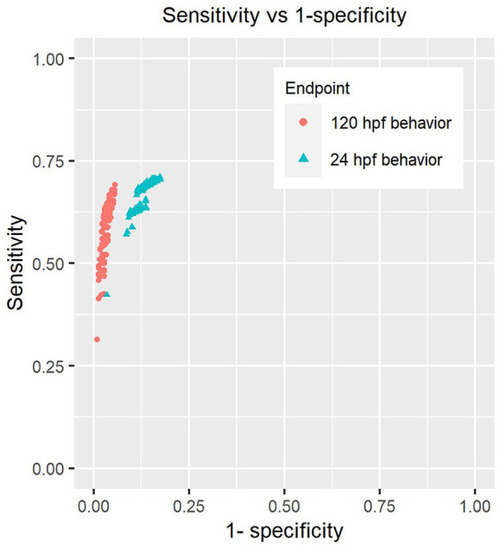
Sensitivity analysis of behavioral endpoints. Each point on the plot represents the sensitivity and specificity of these assays when using a combination of parameters described in section Sensitivity Analysis of Behavioral Responses of Methods to call hits using behavior and morphology (Parameters include the number of endpoints used to make “affected” calls in morphology, |

QQ plot comparing the Benchmark Dose potency estimates for 110 chemicals that were picked by both 24 hpf and 120 hpf behavioral data. |

Venn diagram comparing hits made using behavioral assays when subjected to BMD modeling to those made using morphology screen. |