Image
Figure Caption
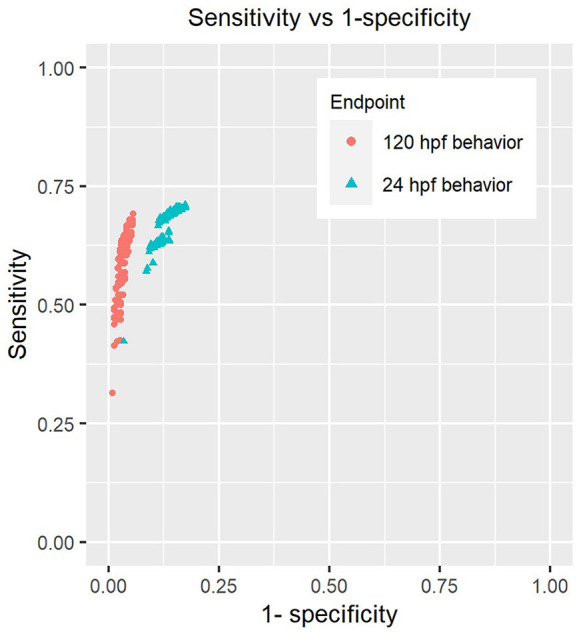
Figure 3
Sensitivity analysis of behavioral endpoints. Each point on the plot represents the sensitivity and specificity of these assays when using a combination of parameters described in section Sensitivity Analysis of Behavioral Responses of Methods to call hits using behavior and morphology (Parameters include the number of endpoints used to make “affected” calls in morphology,
Acknowledgments
This image is the copyrighted work of the attributed author or publisher, and
ZFIN has permission only to display this image to its users.
Additional permissions should be obtained from the applicable author or publisher of the image.
Full text @ Front Toxicol

