
FIGURE SUMMARY
- Title
-
Genetic and Neurological Deficiencies in the Visual System of mct8 Mutant Zebrafish
- Authors
- Rozenblat, R., Tovin, A., Zada, D., Lebenthal-Loinger, I., Lerer-Goldshtein, T., Appelbaum, L.
- Source
- Full text @ Int. J. Mol. Sci.
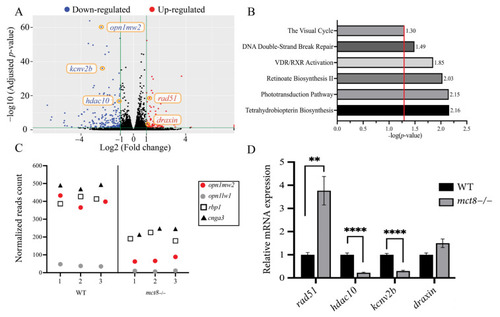
Figure 1. Transcriptome profiling in mct8−/− larvae. (A) Differentially expressed genes in 6 days post-fertilization (dpf) mct8−/− and wild-type (WT) sibling larvae (n = 3 batches for each genotype). Green vertical lines differentiate between significant and insignificant expressed genes. Blue and red dots mark down-regulated and up-regulated genes (1 < log2 [fold change] < 1, adjusted p-value (p-adj) < 0.05), respectively. Black dots mark insignificant expressed genes. Orange circles mark genes validated by qRT-PCR. (B) Representative enriched gene pathways in mct8−/− larvae. The red vertical line marks the threshold of significantly enriched pathways (p-adj ≤ 0.05). (C) Normalized reads count of four differentially expressed genes selected from the enriched vision pathways shown in B. X-axis represents the sample number in each genotype. (D) Relative gene expression of selected genes was quantified using qRT-PCR and normalized against actb (n = 5 batches of larvae for each group). Statistical significance determined by t-test: two-sample. ** p < 0.01, **** p < 0.0001.
|
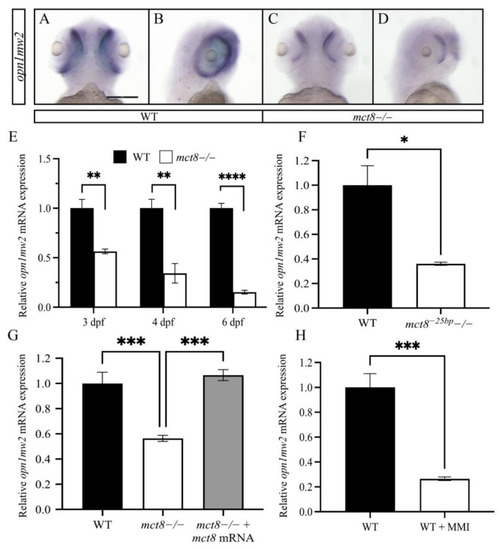
Figure 2. The expression of opn1mw2 is reduced in mct8-deficient larvae. (A–D) Ventral (A,C) and lateral (B,D) views of the spatial expression pattern of opn1mw2 mRNA in 3 dpf WT (A,B) and mct8 −/− (C,D) larvae. Scale bar = 300 μm. (B–E) The relative levels of opn1mw2 mRNA were determined using qRT-PCR. (E) Expression levels in 3, 4, and 6 dpf mct8−/− and WT sibling larvae (n = 5 batches of larvae for each group). (F) Expression levels in 6 dpf mct8−25bp−/− larvae (n = 5 batches of larvae for each group). (G) Expression levels in 3 dpf mct8−/−, WT siblings, and mct8 mRNA-injected mct8−/− embryos (n = 5 batches of larvae for each group). (H) The expression levels of opn1mw2 in WT larvae treated with the TH inhibitor methimazole (MMI) (n = 5 batches of larvae for each group). Relative gene expression was normalized against actb in all assays. Statistical significance determined by t-test: two-sample. * p < 0.05, ** p < 0.01, *** p < 0.001, **** p < 0.0001.
EXPRESSION / LABELING:
PHENOTYPE:
|
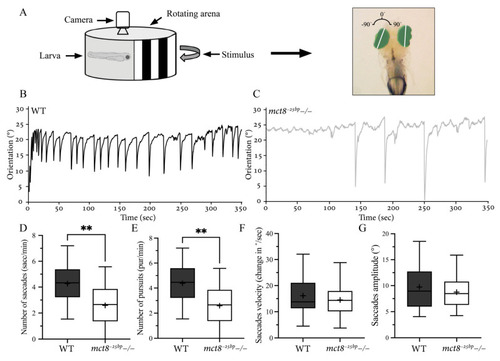
Figure 3. Altered visuomotor behavior in mct8−25bp−/− larvae. (A) Experimental optokinetic reflex (OKR) setup. Video tracking of the eyes under the stimulus of moving vertical black-and-white stripes. The eyes (green region) were distinguished from the background, and the angular orientation of the long axis of each eye (white line) was analyzed. Clockwise and counterclockwise eye orientation was defined as positive and negative angles, respectively. (B,C) The representative curve of the average dynamic orientation of both eyes in 6 dpf WT (B) and mct8−25bp−/− (C) larvae. (D–G) Box plots demonstrate the number, amplitude, and velocity of saccades, as well as the number of pursuits in mct8−25bp−/− (n = 17) and WT sibling (n = 18) larvae. The ‘+’ sign shows the mean. Statistical significance was determined by Mann–Whitney U test. ** (p < 0.01).
PHENOTYPE:
|
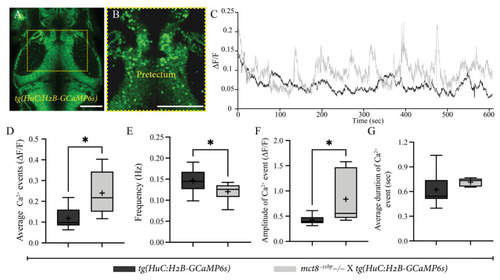
Figure 4. Stronger and slower neuronal activity in the pretectum area in mct8−25bp−/− larvae. (A) Dorsal view of tg(HuC:H2B-GCaMP6s) 6 dpf larva (head pointing to the top). The dashed yellow square marks the enlarged view of the pretectum shown in (B). Scale bar = 50 µm. (C) Average relative fluorescence variation (∆F/F) activity of [mct8−25bp−/− × tg(HuC:H2B-GCaMP6s)] (grey) and their tg(HuC:H2B-GCaMP6s)-siblings (black). (D–G) Changes in single-cell Ca2+ events are presented by the average number of events (D), frequency (E), amplitude (F) and duration (G). The ‘+’ sign shows the mean. tg(HuC:H2B-GCaMP6s)-siblings: n = 9, [mct8−25bp−/− × tg(HuC:H2B-GCaMP6s)]: n = 6). Statistical significance was determined by Mann–Whitney U test. * (p < 0.05).
|
Acknowledgments
This image is the copyrighted work of the attributed author or publisher, and
ZFIN has permission only to display this image to its users.
Additional permissions should be obtained from the applicable author or publisher of the image.
Full text @ Int. J. Mol. Sci.