
Image
|
Figure Caption
Figure 4
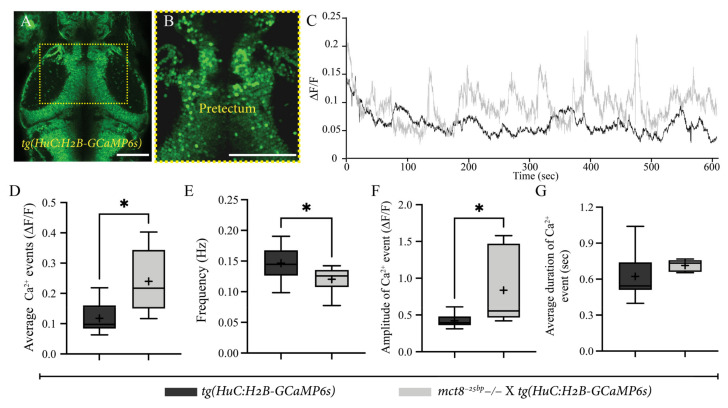
Figure 4. Stronger and slower neuronal activity in the pretectum area in mct8−25bp−/− larvae. (A) Dorsal view of tg(HuC:H2B-GCaMP6s) 6 dpf larva (head pointing to the top). The dashed yellow square marks the enlarged view of the pretectum shown in (B). Scale bar = 50 µm. (C) Average relative fluorescence variation (∆F/F) activity of [mct8−25bp−/− × tg(HuC:H2B-GCaMP6s)] (grey) and their tg(HuC:H2B-GCaMP6s)-siblings (black). (D–G) Changes in single-cell Ca2+ events are presented by the average number of events (D), frequency (E), amplitude (F) and duration (G). The ‘+’ sign shows the mean. tg(HuC:H2B-GCaMP6s)-siblings: n = 9, [mct8−25bp−/− × tg(HuC:H2B-GCaMP6s)]: n = 6). Statistical significance was determined by Mann–Whitney U test. * (p < 0.05).
Figure Data
Acknowledgments
This image is the copyrighted work of the attributed author or publisher, and
ZFIN has permission only to display this image to its users.
Additional permissions should be obtained from the applicable author or publisher of the image.
Full text @ Int. J. Mol. Sci.