
- Title
-
An In Vivo Fluorescence Resonance Energy Transfer-Based Imaging Platform for Targeted Drug Discovery and Cancer Therapy
- Authors
- Huang, S., Jiang, C., Mughal, M.J., Wang, G., Xing, F.
- Source
- Full text @ Front Bioeng Biotechnol
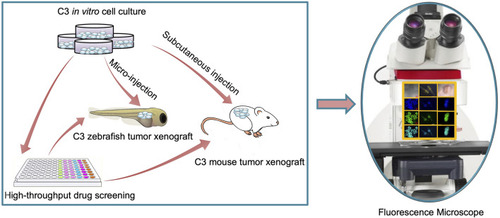
Schematic of FRET-based xenograft model for rapid drug discovery. |

FRET-based detection of drug-induced cancer cell apoptosis in vitro.(A) Principle of caspase-3 reporter Sensor C3. (B) Observation of cell apoptosis in A549-C3 cells treated with 10 µM DOX for 9 h. CFP (ex: 430 nm/em: 480 nm) was merged with YFP (ex: 430 nm/em: 520 nm). Blue cells in merged images indicate apoptotic cells. (C) Time course and dose-dependent detection of cell apoptosis in 231-C3 cells treated with cisplatin. Blue cells in merged images indicate apoptotic cells. Scale bar = 50 µm. |

Tipping points of apoptosis in C3 cells during drug treatment. (A) The flow chart for the selection of single-cell colonies from bulk C3 cells. Single cell clones were harvested from bulk cells by serial dilution in 96-well plate and amplification in 48-well plate. (B) Images of DOX-induced cell apoptosis in single-cell colonies of MDA-MB-231-C3 cells. Red circle indicates single-cell imaging of cell apoptosis. (C) Images of DOX-induced cell apoptosis in single-cell colonies of HepG2-C3 cells. Red circle indicates single-cell imaging of cell apoptosis. (D) Time courses of DOX-induced cell apoptosis of single-cell colonies in MDA-MB-231-C3 cells. (E) Time courses of DOX-induced cell apoptosis of single-cell colonies in HepG2-C3 cells. Green and blue lines indicate total and apoptotic cells, respectively. Scale bar = 50 µm. |

Evaluation of the in vivo drug-induced cell apoptosis in xenograft zebrafish by injecting 231-C3 cells into the zebrafish embryos. (A) Fluorescent images of zebrafish injected with 231-C3 cells and incubated with Ponatinib (10 μM) for 24 h. (B) Images of cell apoptosis in 231-C3 labeled zebrafish after 30 μM cisplatin or 2 μM DOX treatment. Arrows indicate the same zebrafishes observed at different time points. Scale bar = 500 μm. (C) Quantification of FRET ratio in zebrafish after 30 μM cisplatin or 2 μM DOX treatment. n = 6 technical replicates. Data are expressed as mean ± s.e.m. n = 7. *p < 0.05, by Student’s t-test. |
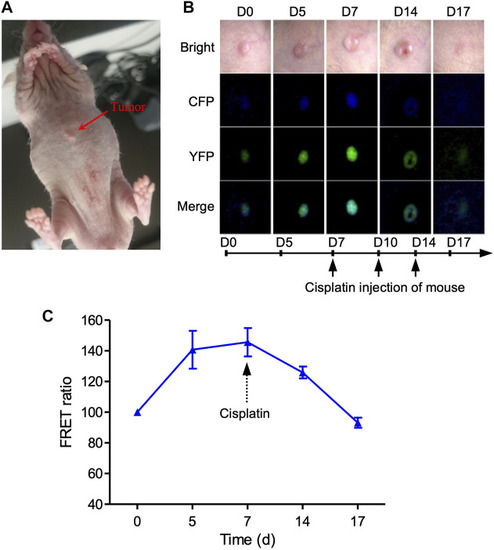
Imaging of cell apoptosis in xenograft tumor mouse in vivo. (A) Imaging of 231-C3 xenograft nude mice and FRET channels of a tumor with no drug treatment. 100 µL 5×10⁶/ml 231-C3 cells were injected into each site of nude mice. Mice were injected with 6 mg/kg cisplatin after the establishment of the tumor xenograft. |