
- Title
-
High-throughput methodology to identify CRISPR-generated Danio rerio mutants using fragment analysis with unmodified PCR products
- Authors
- Colijn, S., Yin, Y., Stratman, A.N.
- Source
- Full text @ Dev. Biol.
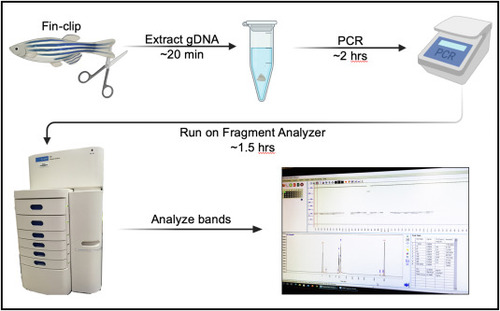
Fig. 1. Genotyping workflow using the Agilent 5300 Fragment Analyzer. Clip a small piece of an adult zebrafish fin (or use a whole embryo) and extract the gDNA. Perform standard PCR using the gDNA and primers that flank the target region of interest. Run the PCR samples on the Agilent 5300 Fragment Analyzer, then analyze the DNA band sizes. The entire protocol—from gDNA extraction to data analysis—can be completed in 4 h (Figure was made using BioRender.com.) |
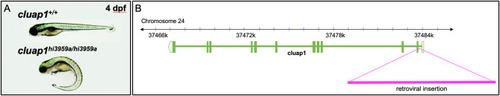
Fig. 2. cluap1hi3959a mutants have a 10 kb retroviral insertion in intron 1 of the cluap1 locus and display body axis symmetry defects. (A) Images of control and cluap1hi3959a/hi3959a homozygous mutants at 4 dpf. Mutants display body curvature, a common phenotype of Danio rerio lines with mutant cilia proteins (Cao et al., 2010; Li and Sun, 2011; Sullivan-Brown et al., 2008). (B) Representation of the Danio rerio cluap1 locus. Cluap1 is oriented on the minus strand of chromosome 24 and has 12 exons. The 10 kb retroviral insertion that was used to make the cluap1hi3959a line sits within intron 1, prior to the translation start site (Li and Sun, 2011). |
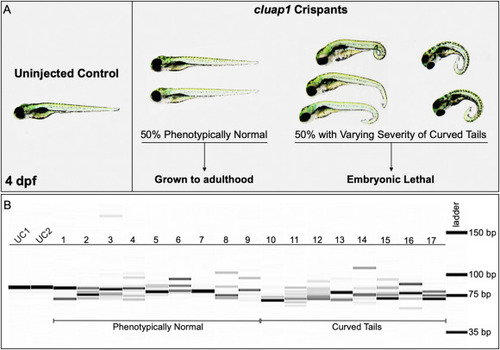
Fig. 3. cluap1 crispants display varying body curvature severity and successful CRISPR targeting. (A) Images of uninjected control (left) and cluap1 crispant embryos (right) at 4 dpf. Approximately 50% of the crispants developed the tail curvature and embryonic lethality indicative of homozygous mutations in cilia proteins (Cao et al., 2010; Li and Sun, 2011; Sullivan-Brown et al., 2008), though the severity of the tail curvature varied. The remaining phenotypically normal survivors were grown to adulthood (F0 generation) to use for breeding stable mutant lines. (B) Crispants were collected at 4 dpf and genotyped for the presence of indels with the fragment analyzer workflow. Image of the fragment analyzer gel output data is shown. The first two lanes (UC1, UC2) are uninjected sibling controls. Lanes 1–9 are crispants that appear phenotypically normal. Lanes 10–17 are crispants that display tail curvature. Only 1 out of 35 genotyped crispants displayed a single wildtype band (Lane 7), indicating a success rate of 97% (34/35) for indel generation. |
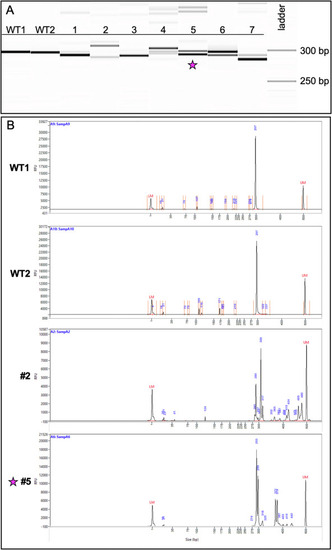
Fig. 4. Genotyping of CRISPR-injected F0 adults reveals a variety of indel species. (A) Image of the fragment analyzer gel output data. The first two lanes (WT1, WT2) are wildtype fish and display a band size of 297 bp. Lanes 1–7 are fish from the CRISPR-injected adult F0 generation. (B) Image of the electropherograms for samples WT1, WT2, 2, and 5. The taller peaks correspond to the more intense bands on the gel. The peaks for #2 (289 bp and 309 bp) suggest the presence of two primary amplicons present in a high percentage of the gDNA: one with a potential 8-bp indel and the other a potential 12-bp indel. Less prevalent amplicons exist at larger bp sizes ranging between 317 and 480 bp. The peaks for #5 (293 bp and 299 bp) suggest the presence of a predominant 6-bp indel. Fish #5 (indicated with a star) was successfully bred and used to establish a stable mutant line. PHENOTYPE:
|
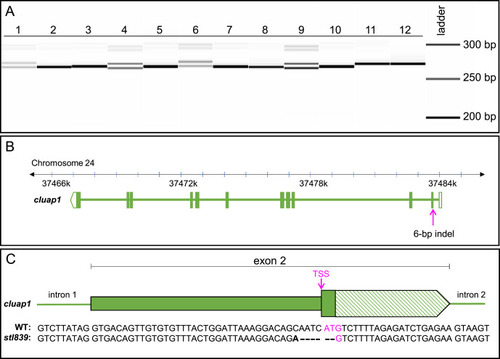
Fig. 5. Genotyping of embryos from the F1 generation reveals germline transmission of the 6-bp indel, which is confirmed via sequencing. (A) Image of the fragment analyzer gel output data. Lanes 1–12 are F1 embryos collected from a cross between F0 fish #5 and a wildtype AB zebrafish breeder. Single bands (Lanes 2, 3, 5, 7, 8, 10, 11, and 12) represent wildtype amplicons. The doublets (Lanes 1, 4, 6, and 9) represent heterozygous carriers of the identified 6-bp indel. (The less intense bands visible at 300 bp are PCR artifacts and are not present with the use of an alternate primer pair.) (B) Representation of the Danio rerio cluap1 locus with the location of the 6-bp indel. The CRISPR target site is in the TSS of cluap1 in exon 2. (C) Representation of exon 2 with the sequencing results for the WT and mutant alleles. The bold letter indicates a single bp change, the dashes indicate bp deletions, and the magenta indicates the TSS. The 6-bp indel allele, now referred to as cluap1stl839, disrupts the TSS, leading to a predicted loss-of-function cluap1 allele. TSS: Translation Start Site (ATG triplet). |
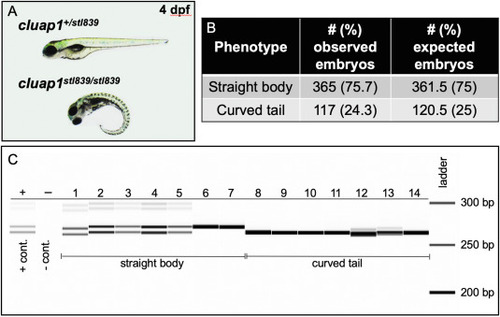
Fig. 6. Cluap1stl839 mutants display body axis symmetry defects that are inherited at the Mendelian ratio and correspond to homozygosity of the mutant allele. (A) Representative images of control sibling and cluap1stl839/stl839 homozygous mutants at 4 dpf. Mutants display body curvature. (B) This curvature is present in 24.3% of total embryos, which suggests Mendelian inheritance of the mutant allele. (Statistics: Chi-square, observed vs. expected, p = 0.75). (C) Image of the fragment analyzer gel output data. Lane ‘+’ is the positive heterozygous control for the 6-bp indel; lane ‘–‘ is the negative control. Lanes 1–14 are F2 embryos bred from an incross between F1 adult cluap1stl839/+ carriers with the 6-bp indel. Lanes 1–7 represent embryos that look phenotypically normal. There is a combination of heterozygous (1–5) and homozygous wildtype (6, 7) alleles in the phenotypically normal group. Lanes 8–14 represent embryos with body curvature. All embryos with curved bodies genotype as homozygous mutants. Notice the slight variability between the sizing of bands in Lanes 1 and 12 compared to similar genotypes. Since each lane is run independently through an individual single capillary, there is a possibility for small sizing shifts between consecutive wells. |
Reprinted from Developmental Biology, 484, Colijn, S., Yin, Y., Stratman, A.N., High-throughput methodology to identify CRISPR-generated Danio rerio mutants using fragment analysis with unmodified PCR products, 22-29, Copyright (2022) with permission from Elsevier. Full text @ Dev. Biol.