
- Title
-
Regeneration of Jaw Joint Cartilage in Adult Zebrafish
- Authors
- Smeeton, J., Natarajan, N., Anderson, T., Tseng, K.C., Fabian, P., Crump, J.G.
- Source
- Full text @ Front Cell Dev Biol
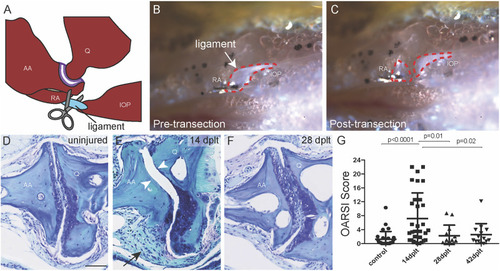
Joint degeneration and recovery following ligament transection surgery. |
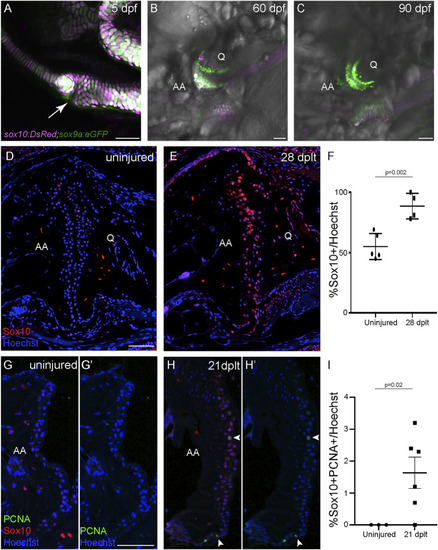
Sox10 expression is upregulated during cartilage regeneration. (A–C) sox10:DsRed and sox9a:eGFP are broadly co-expressed in chondrocytes at 5 days post-fertilization (dpf), and sox10:DsRed becomes restricted to a subset of joint chondrocytes at 60 and 90 dpf. The arrow shows the developing jaw joint at 5 dpf. (D,E) Antibody staining of the adult jaw joint shows endogenous Sox10 protein (red) in joint cells in 1-year-old uninjured control (D) and interopercular–mandibular (IOM)-transected animals at 28 days post-ligament transection (dplt) (E). (F) Quantification of Sox10+ cells as a percentage of total Hoechst+ cells at the jaw joint articular surface. Individual data points, mean, and standard error of the mean are shown. The p-value is calculated by two-tailed Student’s t-test. (G,H) Antibody staining for PCNA (green) and Sox10 (red) of adult jaw joints from uninjured controls (G,G′) and IOM-transected animals at 21 dplt (H,H′). The white arrowheads indicate double-positive PCNA+/Sox10+ nuclei. (I) Quantification of double-positive PCNA+/Sox10+ chondrocyte nuclei as a percentage of total Hoechst-stained nuclei at the jaw joint articular surface. Individual data points, mean, and standard error of the mean are shown. The p-value was calculated using Welch’s two-tailed t-test. AA, anguloarticular bone; Q, quadrate bone. Scale bars = 50 μm. |
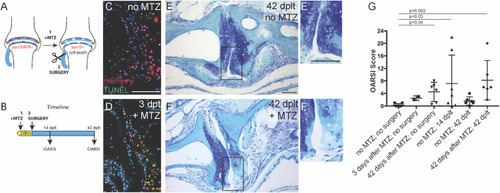
Sox10-expressing cells are required for cartilage regeneration. (A) Genetic ablation model. (B) Timeline for treatment and analysis. (C,D) Antibody and TUNEL staining of the adult jaw joint shows mCherry expression in sox10:mCh-NTR adult joint cells and apoptotic cells in metronidazole (Mtz)-treated animals at (D) 3 days after Mtz treatment (days post-ligament transection, dplt). (E,F) Toluidine blue staining of joints at 42 dplt without (E) or with Mtz treatment (F) prior to ligament injury (insets in E′ and F′ show the details of the articular surface). (G) OARSI scoring of joint integrity following Mtz treatment and/or ligament injury. Individual data points, mean, and standard error of the mean are shown. The p-values are calculated by Kruskal–Wallis ANOVA and Dunn’s multiple-comparison test. Scale bars = 50 μm. |
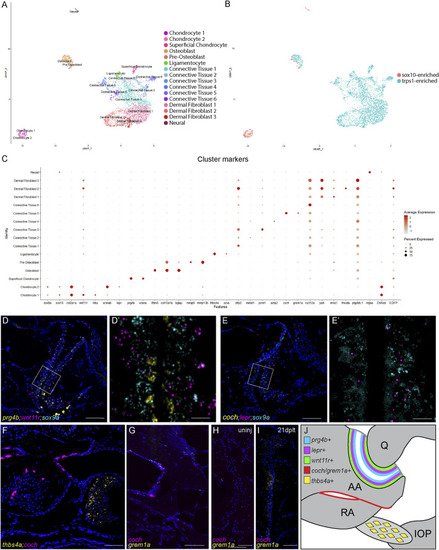
Single-cell transcriptome of adult zebrafish jaw joint. (A, B) UMAP visualization of scRNAseq analysis of FACS-sorted 3-month-old jaw joints. The colors were based on clustering (A) or library of origin (B). (C) Dot plot showing the marker gene expression for each cell cluster as well as DsRed and GFP transcripts. (D–G) RNAscope in situ hybridization for markers for chondrocyte clusters (D,E), for CT5 (coch) and ligament (thbs4a) (F), and for CT5 (coch and grem1a) (G). Nuclei stained with DAPI in blue. The magnified regions of the boxed regions (D′,E′) highlight different zones of joint chondrocytes and are shown without the DAPI channel. The section in (F) is above the jaw joint sections of (D,E). (H,I) RNAscope in situ hybridization for grem1a and coch at the articular surface of uninjured (H) and 21 dplt (I) jaw joints. Nuclei stained with DAPI in blue. (J) Model of chondrocyte zones (blue, purple, and green), joint-adjacent periosteum (red), and interopercular–mandibular ligament (yellow) with marker genes in the adult jaw joint. Scale bars = 50 μm (D–H) and 10 μm (D′,E′). |