
- Title
-
The Wilms Tumor Gene wt1a Contributes to Blood-Cerebrospinal Fluid Barrier Function in Zebrafish
- Authors
- Hopfenmüller, V.L., Perner, B., Reuter, H., Bates, T.J.D., Große, A., Englert, C.
- Source
- Full text @ Front Cell Dev Biol
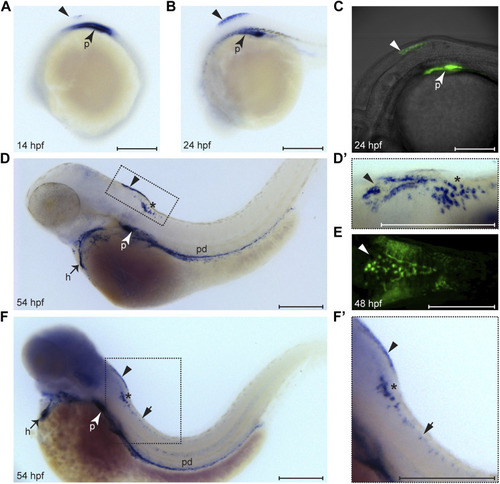
Expression pattern of wt1a during embryonic and larval development. Wt1a expression was analyzed by whole mount in situ hybridization (A, B, D, D′, F, F′) and via examination of the EGFP signal in animals carrying the wt1a:EGFP transgene (C, E). (A) In addition to the known and prominent expression in the developing pronephros (arrowhead), weak expression of wt1a is present in the presumptive dorsal hindbrain at 14 hpf (triangle). (B) The dorsal hindbrain domain appeared more prominent at 24 hpf. (C) Overlay of transmission and fluorescent images of a Tg(wt1a:EGFP) embryo reveals that the domain described in B is located at the most posterior region of the hindbrain. (D) At 54 hpf wt1a expression is detected in the pronephros, in the heart, along the pronephric duct and in two domains of the hindbrain. In addition to the above mentioned very dorsally located domain (arrowhead) the wt1a transcript is also present in a more ventral region (asterisk). (D′) A closer, dorsolateral view on both hindbrain domains illustrates that the dorsal domain (arrowhead) has a triangular shape with a compact structure in the middle. (E) The EGFP signal arising from a 2 day old embryo of the wt1a transgenic line closely recapitulates the v-shaped expression described in D’. (F-F′) Upon extended staining of a 54 hpf larva wt1a expressing cells are also detectable in the spinal cord (short arrow). A-D, F and F′ are lateral views, D′ is a dorsolateral and E a ventral view. All images are with rostral to the left. h: heart; p: pronephros; pd: pronephric duct. Scale bars: 200 μm. EXPRESSION / LABELING:
|
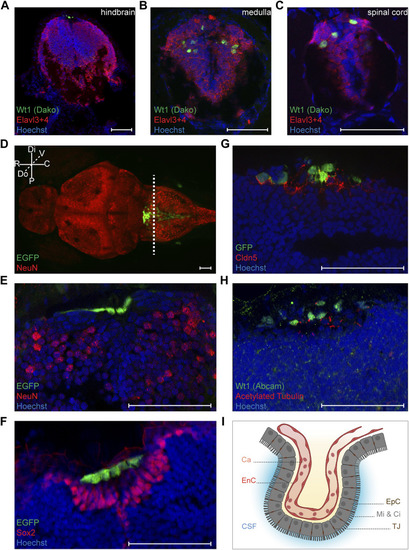
Characterization of Wt1+ cells of the zebrafish larval CNS. (A-C) Transverse sections through the hindbrain, the caudal medulla and spinal cord of 4.25 days old Tg(wt1a:EGFP) zebrafish larvae were stained with antibodies against Wt1 (Dako) and Elavl3+4. The images show optical sections of one focus plane. Orientation: dorsal: up. Scale bar: 50 µm. (D) Whole zebrafish larvae (4.5 dpf) of the Tg(wt1a:EGFP) line were used for detection of the EGFP signal of Wt1 positive cells and IHC against NeuN. The image is displayed as extended depth of focus projection. The fluorescence signal for EGFP does not overlap with NeuN staining. The dotted line indicates the cutting position of the following transverse sections. Orientation: rostral: left; dorsal view. Abbreviations: distal (Di); proximal (P); rostral (R); caudal (C); dorsal (Do); ventral (V) Scale bar: 50 µm. (E) Transverse section through the hindbrain of 4.25 days old Tg(wt1a:EGFP) zebrafish larvae were used for detection of the EGFP signal of Wt1 positive cells and IHC against NeuN. (F) Transverse sections through the hindbrain of 4.25 days old Tg(wt1a:EGFP) zebrafish larvae were used for detection of the EGFP signal of Wt1 positive cells and IHC against Sox2. (G) Transverse sections through the hindbrain of 4.25 days old Tg(wt1a:EGFP) zebrafish larvae were used for IHC against GFP and Cldn5. (H) Transverse sections through the hindbrain of 4.25 days old Tg(wt1a:EGFP) zebrafish larvae were used for IHC against Wt1 (Abcam) and acetylated Tubulin. (E–H) The images show optical sections of one focus plane. Orientation: dorsal: up. Scale bar: 50 µm. (I) Schematic illustration of the ependymal cells of the fourth brain ventricle, which are connected via tight junctions and show microvilli and cilia at their apical surface. The image was created with BioRender.com. Abbreviations: capillary (Ca); endothelial cell (EnC); cerebrospinal fluid (CSF); ependymal cells (EpC); microvilli (Mi); Cilia (Ci); tight junction (TJ). EXPRESSION / LABELING:
|
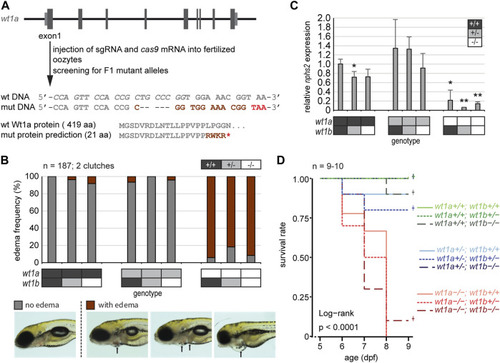
Inactivation of wt1a results in edema formation and early lethality. (A) Schematic drawing of the wt1a gene locus and mutant generation. With the help of CRISPR/Cas, a fish line was established that lacks five nucleotides in exon 1 of the wt1a gene (wt1a ex1_del5 ). The sgRNA target sequence is italicized in the wild type DNA sequence. The 5 nt deletion is predicted to result in a frame shift (dark red) and a premature termination codon (red) that leads to a truncation of the protein. Abbreviations: wt (wild type); mut (mutant). (B) Offspring of a double heterozygous incross (wt1a +/-;wt1b +/-) were screened for the formation of edema at five dpf. The majority of wt1a −/− larvae have body edemas (arrows), independent of the wt1b ex2_del5 background. Example pictures for no edema (grey), and body edemas (dark red) are shown; n = 187. (C) qRT-PCR analysis of offspring of a double heterozygous incross (wt1a +/-;wt1b +/-) indicates a strong reduction of nphs2 expression in wt1a −/− larvae. n = 3 (three to five larvae each). Error bars represent standard error. One-way ANOVA was calculated as p = 3.98*10–05. p-values are calculated with a t-test by pairwise comparison to wild type (wt1a +/+; wt1b +/+). (D) Survival of offspring of a double heterozygous incross (wt1a +/-;wt1b +/-) from five to nine dpf shows an early onset of lethality of homozygous wt1a −/− larvae, independent of the wt1b ex2_del5 background. Survival is shown as a Kaplan-Meier curve. n = 9–10 larvae per genotype. |
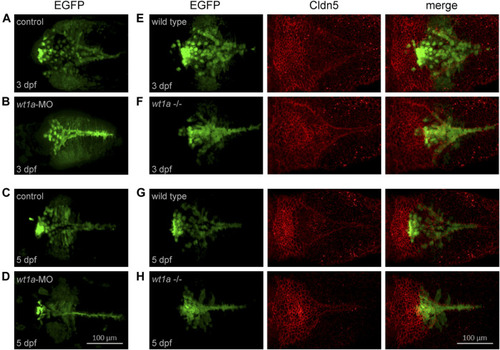
Wt1a morphants and mutants show anomalies in choroid plexus development. For the analysis of morphants the Tg(wt1a:EGFP) line and for mutants the Tg(wt1a:EGFP); wt1a ex1_del5 line has been used. (A–D) Wt1+ positive cells, visualized by EGFP fluorescence, in zebrafish larvae injected with control morpholino (A,C) or wt1a morpholino (B,D) at three dpf (A,C) and five dpf (B,D). (E–H) Wt1+ positive cells (left), visualized by EGFP fluorescence in wildtype (E,G) or homozygous wt1a mutant larvae (F,H) of the Tg(wt1a:EGFP) line were stained with a-Cldn5 antibody (middle) at three dpf (E,F) and five dpf (G,H). All panels represent 3D reconstructions of image stacks (dorsal views with rostral to the left). EXPRESSION / LABELING:
PHENOTYPE:
|
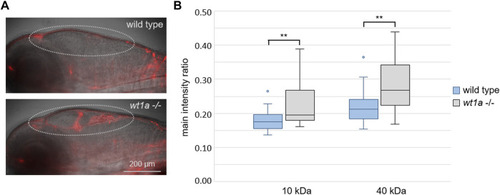
Wt1a inactivation reduces the blood-CSF barrier function. Fluorescently labeled dextrans were injected into the cardinal vein of 5 days old larvae of the wt1a ex1_del5 line and leakage into the ventricles was analyzed. (A) Representative overlay images of transmission and rhodamin-dextran (10 KDa) fluorescence recorded by light sheet microscopy of larvae that were fixed 4 h after injection. The dotted line marks the ventricular system. (B) Ratios of fluorescence intensities of rhodamin-dextran (10 KDa) and fluorescein-dextran (40 kDa) in the ventriclular region relative to the respective fluorescence in the pupil were estimated in vivo 40 min post injections. n = 24 for wild types and 22 for mutants; p-values according to ANOVA: 0.003 and 0.002 (**) for 10 and 40 kDa, respectively. PHENOTYPE:
|