
- Title
-
Shutdown corner, a large deletion mutant isolated from a haploid mutagenesis screen in zebrafish
- Authors
- Casey, M.A., Hill, J.T., Hoshijima, K., Bryan, C.D., Gribble, S.L., Brown, J.T., Chien, C.B., Yost, H.J., Kwan, K.M.
- Source
- Full text @ G3 (Bethesda)
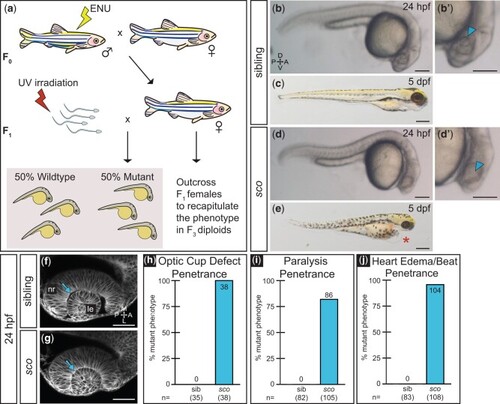
Shutdown corner, isolated in a haploid screen, exhibits a gross morphological defect of the optic cup. a) Haploid mutagenesis screen strategy. b, d) A defect in optic cup morphology is visible at 24 hpf. Lateral view of sibling b) and sco mutant d) diploid embryos under dissecting stereomicroscope. Zoomed views of sibling b′) and sco d′) lens regions (arrowheads), in which the lens is difficult to discern in the sco mutant. c, e) sco mutants exhibit heart edema (asterisk) and die around 5 dpf. f, g) Optic cup morphogenesis in live-imaged, membrane-labeled samples: a lens forms in sibling f) and sco mutants g) and is enwrapped by the developing retina in both. Dorsal view, single confocal section of 24 hpf Tg(bactin2:EGFP-CAAX) embryos. Arrows indicate the separation f) or apparent close association g) between the lens and neural retina. The sco mutant 24 hpf optic cup h), 3 dpf paralysis i), and 3 dpf heart edema/slowed heartbeat j) phenotypes are highly penetrant when screened on confocal or stereomicroscope. (h: sib = 0%, sco = 100%; i: sib = 0%, sco = 81.9%; j: sib = 0%, sco = 96.3%). A, anterior; L, lateral; le, lens; M, medial; nr, neural retina; P, posterior. Scale bar: b, b′, d, d′: 170 µm; c, e: 310 µm; and f, g: 50 µm. |
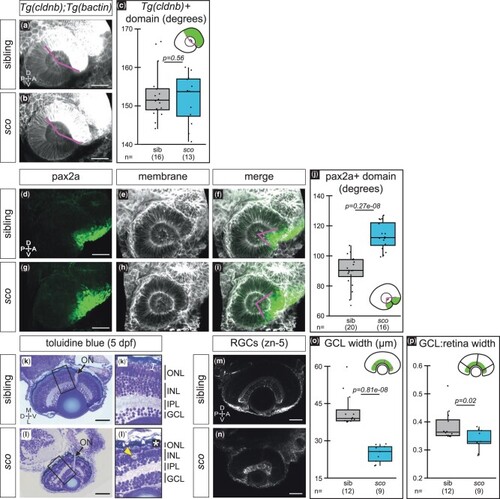
Optic cup patterning is partially altered and retinal defects arise in shutdown corner. a–c) Expression of Tg(cldnb:lyn-EGFP), which labels the nasal (anterior) hemisphere of the optic cup at 24 hpf. 3D-rendered, lateral view of Tg(cldnb:lyn-EGFP);Tg(bactin2:EGFP-CAAX) embryos. a, b) Magenta lines demarcate Tg(cldnb:lyn-EGFP)-positive region. c) Quantification of Tg(cldnb:lyn-EGFP)-positive domain per embryo. d–j) Antibody staining for pax2a, a ventral marker, at 24 hpf. 3D-rendered, lateral views. Pax2a (d, g; green), cell membranes (e, h; grayscale, EGFP-CAAX), merge f, i). Magenta lines f, i) demarcate pax2a-positive region. j) Quantification of the pax2a-positive domain per embryo. k, l) 5 dpf histological sections stained with toluidine blue (imaged at 40x, sections at similar depth based on presence of optic nerve; sibling n = 2, sco n = 3) with zoomed views of the retina (k′, l′). Arrows, optic nerve; bracket, photoreceptor outer segments k′); asterisk, missing photoreceptor outer segments l′); arrowhead, potential cell death l′). m–p) RGCs (zn-5 staining) at 5 dpf. Ventral view, single confocal section from 3D datasets of antibody-stained samples. o, p) Quantification of GCL thickness, presented as the raw width o) and the width normalized to the total width of the retina p). Width measurements were taken at three places in each retina, at a nasal, temporal, and nasal-temporal midpoint; each point represents the average GCL width (raw or normalized) per embryo. ON, optic nerve; ONL, outer nuclear/photoreceptor layer; INL, inner nuclear layer; IPL, inner plexiform layer; GCL, ganglion cell layer; RGC, retinal ganglion cell; A, anterior; D, dorsal; L, lateral; M, medial; ON, optic nerve; P, posterior; V, ventral. Scale bar, 50 µm. |
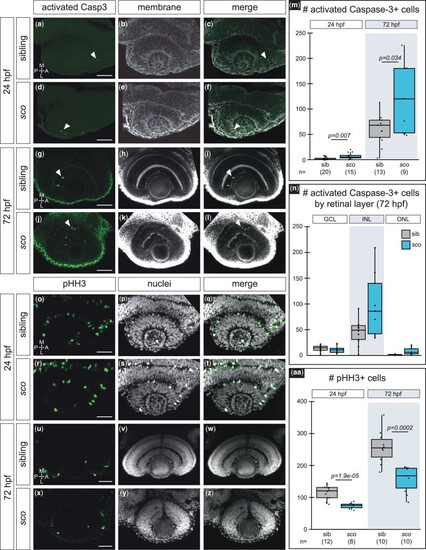
Cell death and proliferation are affected in the shutdown corner retina. a–n) Activated caspase-3-positive cells at 24 hpf a–f) and 72 hpf g–l) in siblings and sco mutants. Dorsal (24 hpf) or ventral (72 hpf) view, single confocal section from 3D datasets of antibody-stained Tg(bactin2:EGFP-CAAX) samples. Activated caspase-3 (a, d, g, j; green), cell membranes (b, e, h, k; grayscale, EGFP-CAAX), merge (c, f, i, l). Arrowheads (a, c, d, f, g, i, j, l), activated caspase-3 positive cells in the retina. m) Quantification of cells positive for activated caspase-3 in the retina, per embryo. n) Quantification of cells positive for activated caspase-3 at 72 hpf in each retinal layer, per embryo. o–aa) Phospho-histone H3 (pHH3)-positive cells at 24 hpf o–t) and 72 hpf u–z) in siblings and sco mutants. Dorsal (24 hpf) or ventral (72 hpf) view, single confocal section from 3D datasets of antibody-stained samples. pHH3 (o, r, u, x; green), nuclei (p, s, v, y; grayscale, TO-PRO-3), and merge (q, t, w, z). aa) Quantification of cells positive for pHH3 in the retina, per embryo. GCL, ganglion cell layer; INL, inner nuclear layer; ONL, outer nuclear layer; A, anterior; L, lateral; M, medial; P, posterior. Scale bar, 50 µm. |
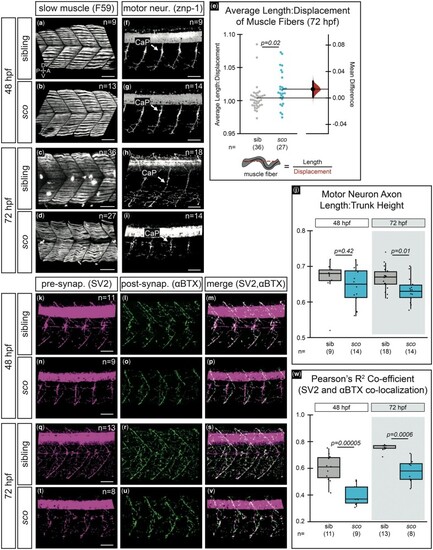
Shutdown corner has defective slow muscle fibers, motor neurons, and neuromuscular junctions. Slow muscle fibers (F59 staining) at 48 hpf a, b) and 72 hpf c, d) in siblings and sco mutants. e) Quantification of slow muscle fiber length-to-displacement ratio at 72 hpf presented as a Gardner-Altman estimation plot. Left dot plots, each data point represents an average of 8–14 fibers per single embryo measured as schematized. Right bootstrap sampling distribution, the mean difference between siblings and mutants is 0.0133 (95% CI: 0.00188, 0.0252). Mean difference depicted as a dot; 95% CI indicated by ends of vertical error bar reflects the effect size. f–j) Motor neurons (znp-1 staining) at 48 f, g) and 72 hpf h, i) in siblings and sco mutants. j) Quantification of motor neuron axon length normalized to trunk height. Three axons were measured per embryo; each point represents the average length ratio per embryo. k–w) Presynaptic terminals (SV-2 staining) and postsynaptic terminals (α-bungarotoxin or αBTX staining) at 48 hpf k–p) and 72 hpf q–v). SV-2 (k, n, q, t; magenta), αBTX (l, o, r, u; green), merge m, p, s, v). w) Quantification of SV-2 and αBTX colocalization at 48 and 72 hpf for one side of the trunk, per embryo. All images are 3D rendered, lateral views of the trunk region, dorsal to the yolk extension. Sample size (n) in images. A, anterior; CaP, caudal primary motor neuron; D, dorsal; P, posterior; V, ventral. Scale bar, 50 µm. |
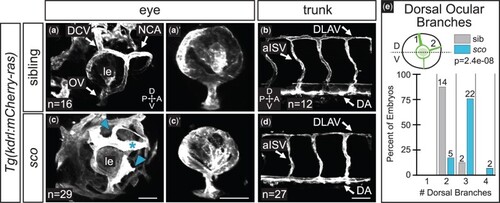
Ocular vasculature but not trunk vasculature is disrupted in shutdown corner. Ocular a, c) and trunk b, d) vasculature at 48 hpf [grayscale, Tg(kdrl:mCherry-ras)]. 3D renderings, lateral views. a′, c′) Hyaloid network; superficial vasculature cropped away in FluoRender. c) Arrowheads indicate ectopic branches; asterisk indicates a morphologically abnormal vessel. e) Quantification of the number of superficial ocular vessels in the dorsal half of the eye at 48 hpf. Dashed line in schematic demarcates the dorsal (D) and ventral (V) halves of the eye. Sample size (n) in images. a–d) Arrows pair labels with corresponding vessels. le, lens; DCV, dorsal ciliary vein; NCA, nasal ciliary artery; OV, optic vein; DLAV, dorsal longitudinal anastomosing vessel; aISV, arterial intersegmental vessel; A, anterior; P, posterior; D, dorsal; V, ventral. Scale bar, 50 µm. |
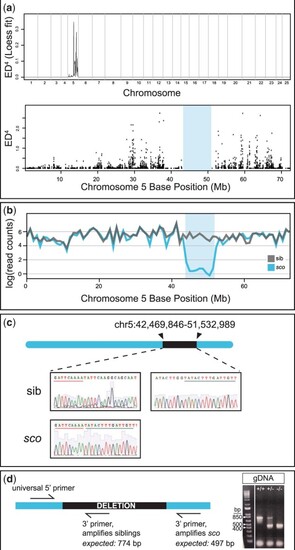
Shutdown corner harbors a large deletion on chromosome 5. a) Top, Genome wide Euclidean distance scores, fit with a local regression (LOESS) curve and raised to the fourth power to decrease noise. Note the large feature on chromosome 5. Bottom, Raw Euclidean distance scores for chromosome 5; note the gap between ∼40 and 50 Mb (shaded region). b) Comparison of RNA-sequencing read counts, fit with a local regression, between wild-type sibling (gray) and sco mutants (blue). There is a dramatic decrease in mapped reads in the ∼40–50 Mb region. c) Sanger sequencing of a wild-type sibling and sco mutant confirms the shutdown corner breakpoint. d) Schematic of genotyping primers and image of PCR products from genomic DNA (gDNA); using the three primers, the wild-type amplicon is 774 bp and the sco amplicon is 497 bp; heterozygotes have both a wild-type and sco mutant amplicon. Reference band sizes in ladder are annotated. Bp, base pair. |