
- Title
-
Multiple Mechanisms Converging on Transcription Factor EB Activation by the Natural Phenol Pterostilbene
- Authors
- La Spina, M., Azzolini, M., Salmaso, A., Parrasia, S., Galletta, E., Schiavone, M., Chrisam, M., Mattarei, A., Di Benedetto, G., Ballabio, A., Tiso, N., Zoratti, M., Biasutto, L.
- Source
- Full text @ Oxid Med Cell Longev
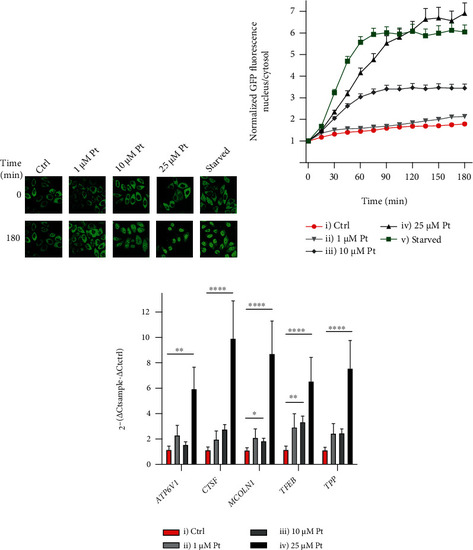
Pt induces translocation and activation of TFEB in HeLa cells. TFEB migration kinetics: (a) representative images of HeLa cells overexpressing TFEB-GFP, treated as indicated, and (b) plot of the nucleus/cytosol green fluorescence ratios after the indicated additions or medium exchange at time zero.Mean values + SEM; N ≥ 55 cells for each time point and condition, observed in at least 3 separate experiments. Comparison with Ctrl: p < 0.0001 rom 15 min for curves (iii), (iv), and (v); p < 0.05 from 135 min for curve (ii). (c) Pt enhances the transcription of TFEB and its target genes. Mean values + SEM; N ≥ 5. Horizontal bar extremities correspond to the columns to be compared. |
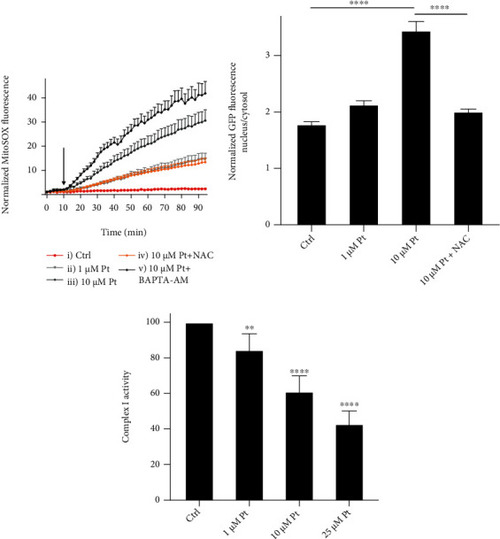
Pt elicits mitochondrial superoxide generation in HeLa cells. (a) MitoSOX™ fluorescence response elicited by Pt. The cells in curves iv) and v) were pretreated, respectively, with 1 mM NAC (60 min) or 5 μM BAPTA-AM (20 min), and continued to be incubated with these agents also during treatment with Pt. The arrow indicates the addition of Pt. Mean values + SEM. (b) NAC antagonizes Pt-induced TFEB migration to the nucleus. TFEB migration in HeLa cells exposed to the indicated conditions for 3 hours. Mean values + SEM. N > 53 cells for each tested condition, from at least 4 separate experiments. (c) Pt inhibits Complex I activity in permeabilized RLM. Mean values + SEM; N = 6. |
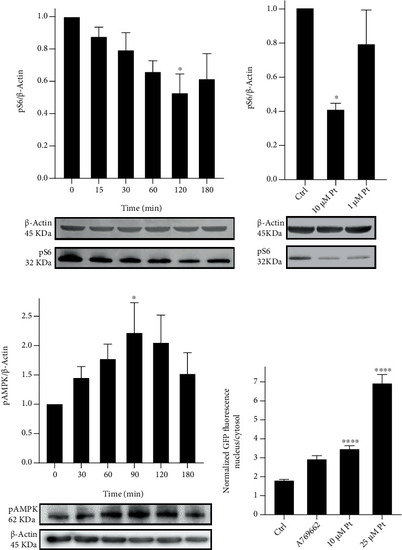
(a, b) Pt determines mTORC1 inhibition in HeLa cells. Western blot analysis of phospho-S6 (S240/244). (a) Time-dependent reduction of S6 phosphorylation by 25 μM Pt. (b) Effect on S6 phosphorylation of a 2 h treatment with 10 or 1 μM Pt. Representative Western blot images are shown below the histograms. Mean values + SEM; N ≥ 4. (c, d) AMPK is activated by Pt in HeLa cells. (c) Western blot analysis of phospho-AMPK (T172). Time-dependent increase in AMPK phosphorylation by 25 μM Pt. Representative Western blot images are shown below the histograms. Mean values + SEM; N ≥ 4. (d) A partial TFEB-GFP migration is elicited by pharmacological AMPK activation. TFEB migration in HeLa cells exposed to 25 and 10 μM Pt (same data as in Figure 1(b)) or to 25 μM A769662 for 3 hours. Mean values + SEM. N ≥ 20 cells for each condition, observed in at least 3 separate experiments. |

Pt elicits Ca2+ signaling in HeLa cells; N > 36 for each time point and condition, observed in at least 3 separate experiments. (a) Cytosolic Ca2+ signals induced by 25 μM Pt (Fluo-4 fluorescence). The arrow indicates the addition of 0.1% DMSO in curve i) and of 25 μM Pt in curves ii), iii), iv), v), and vi). The cells in curve vi) were pretreated for 20 min and continued to be incubated after Pt addition with 5 μM BAPTA-AM. (b) Cytosolic Ca2+ signals elicited by 25 μM Pt after pretreatment of the cells and in the continuing presence of modulators. 25 μM Pt was added when indicated by the black arrow for curves iii) and iv), when indicated by the grey arrow for curve ii). Modulators were as follows: ii) 2 μM FCCP, added when indicated by the black arrow (no preincubation); iii) 10 mM NAC (preincubation, 30 min); iv) 0.8 μM NIM811 (preincubation, 20 min); i) control: addition of DMSO (0.1% final concentration) when indicated by the black arrow. Please note the difference of the Y scale between panels (a) and (b). (c) Ca2+ mobilized by Pt largely originates from ER. Curve i): the SERCA inhibitor CPA (20 μM) was added when indicated by the black arrow; Pt (25 μM) when indicated by the grey arrow. Curve ii): the sequence of the additions was the opposite (Pt first). In both cases, excess EGTA was added to the medium 30 sec before the first addition. (d) The cellular Ca2+ mobilized by Pt in HeLa cells comes mostly from subcellular compartments other than the lysosomes (see text for details). Normalized Fluo-4 fluorescence. (e) Cytosolic Ca2+ signals elicited by 10 μM Pt measured with the ratiometric probe Fura-2. The arrow indicates the addition of: i) 0.1% DMSO; ii) 10 μM Pt. The difference between the two curves is significant ( p < 0.05 ) from t = 5 min onwards. (a–e) Error bars are omitted for clarity. (f) TFEB migration in HeLa cells exposed to the indicated conditions for 3 hours. Mean values + SEM. |
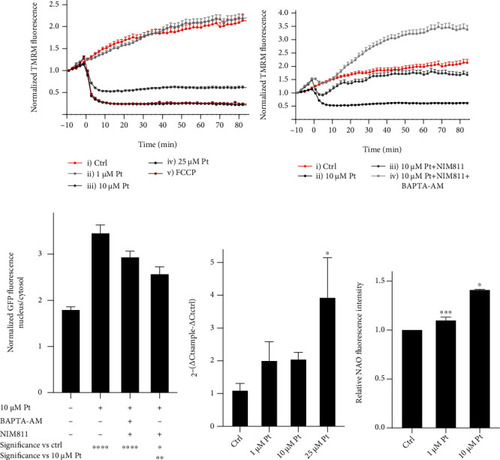
Impact of Pt on mitochondria. (a, b) Pt induces mitochondrial depolarization. Normalized fluorescence intensity of TMRM-loaded HeLa cells, treated as indicated. (c) TFEB migration (expressed as nuclear/cytosolic fluorescence ratio) in HeLa cells exposed to the indicated conditions for 3 hours. Mean values + SEM. N ≥ 20 cells for each time point and condition, observed in at least 3 separate experiments. (d, e) Pt increases mitochondrial biogenesis in WT HeLa cells. (d) RT-qPCR analysis of PPARGC1a. N ≥ 3. Error bars: + SEM. (e) Pt induced a concentration- dependent increase in mitochondrial mass after 48 h. FACS measurements of NAO fluorescence in HeLa cells. Mean values + SEM; N ≥ 4. |

Pt-induced autophagy and TFEB activation in vivo. (a–e) Evidence of Pt-induced autophagy and functional improvement in dystrophic zebrafish morphants with altered Collagen VI. (a) Representative Western blot and quantification of the lipidated form of LC3 in zebrafish embryos treated as indicated. Mean values + SEM; N ≥ 3. (b, c) Birefringence assay. (b) Representative images from WT fish or ColVI morphants (Ex9 MO) after treatment with Pt or 0.1% DMSO (Ctrl). (c) 1 μM Pt induced a significant increase in the birefringence of morphants at 48 hpf. The percentage of fish showing a severe phenotype of ColVI-related myopathy was considerably reduced by 1 μM Pt (Pt vs Ctrl: p =0.016). Mean values + SEM. N ≥ 60 embryos for each condition, from at least 3 separate experiments. (d) Touch-evoked response assay. 1 μM Pt increased the percentage of fish showing mild or normal phenotypes (p = 0.0007). Responses were evoked by touching 48 hpf embryos with a tip. N ≥ 70 events for each condition, from at least 3 separate experiments. (e) Spontaneous coiling events of ColVI morphants measured at 24 hpf after 3 hours of treatment with Pt. 1 μM Pt completely rescues the deficit of spontaneous movements. Mean values + SEM. N ≥ 100 events for each condition, from at least 3 separate experiments. (f) RT-qPCR of Tfeb transcription in inguinal white adipose tissues from obese (HFD) and Pt-treated (HFD + Pt) mice. Mean values + SEM, N ≥ 14 mice for each condition. PHENOTYPE:
|