
|
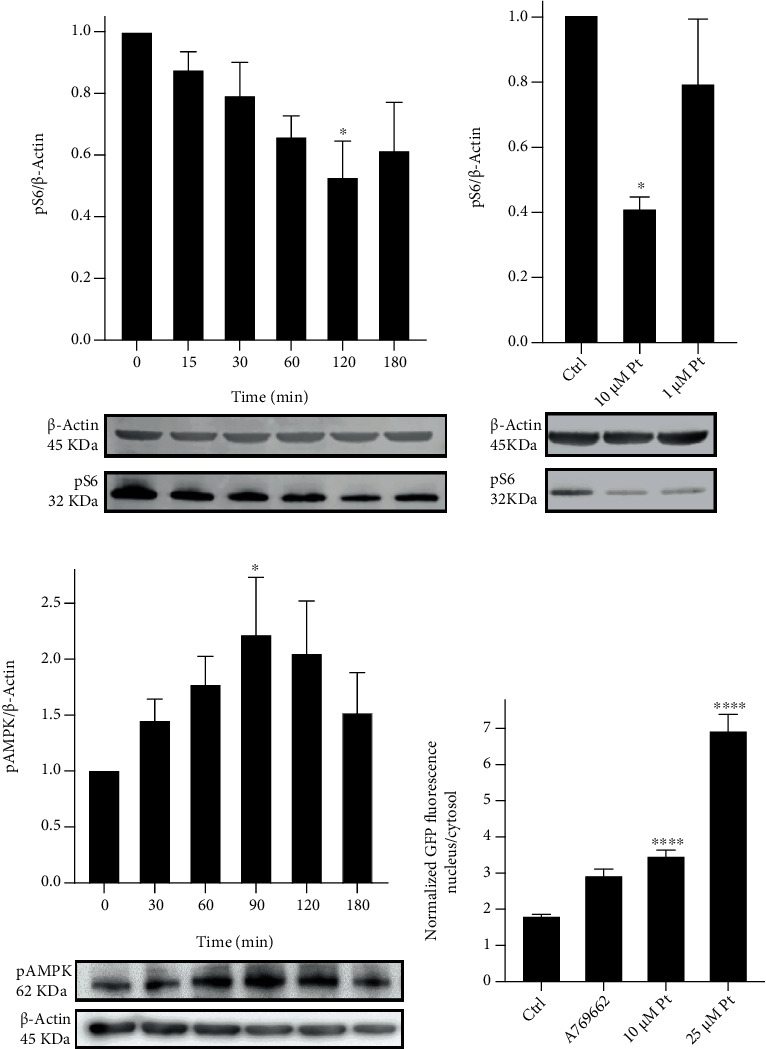
Figure 3 (a, b) Pt determines mTORC1 inhibition in HeLa cells. Western blot analysis of phospho-S6 (S240/244). (a) Time-dependent reduction of S6 phosphorylation by 25 μM Pt. (b) Effect on S6 phosphorylation of a 2 h treatment with 10 or 1 μM Pt. Representative Western blot images are shown below the histograms. Mean values + SEM; N ≥ 4. (c, d) AMPK is activated by Pt in HeLa cells. (c) Western blot analysis of phospho-AMPK (T172). Time-dependent increase in AMPK phosphorylation by 25 μM Pt. Representative Western blot images are shown below the histograms. Mean values + SEM; N ≥ 4. (d) A partial TFEB-GFP migration is elicited by pharmacological AMPK activation. TFEB migration in HeLa cells exposed to 25 and 10 μM Pt (same data as in Figure 1(b)) or to 25 μM A769662 for 3 hours. Mean values + SEM. N ≥ 20 cells for each condition, observed in at least 3 separate experiments.