
- Title
-
16pdel lipid changes in iPSC-derived neurons and function of FAM57B in lipid metabolism and synaptogenesis
- Authors
- Tomasello, D.L., Kim, J.L., Khodour, Y., McCammon, J.M., Mitalipova, M., Jaenisch, R., Futerman, A.H., Sive, H.
- Source
- Full text @ iScience
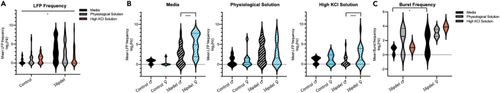
Augmented local field potential activity in 16pdel syndrome differentiated neuronal culture (A) Local Field Potential (LFP) summary analyzed by log2 fold change between control and 16pdel patient differentiated neurons. MEA activity was recorded over 30 min starting in media, followed by physiological and high potassium chloride (KCl) solution. Data was summarized and pooled from 3 experiments. Control n = 9 (media), n = 17 (Physiological Solution), n = 13 (High KCl Solution). 16pdel n = 35 (media), n = 76 (Physiological Solution), n = 35 (High KCl Solution). Violin plot group analysis: Control - 16pdel two-way ANOVA. ∗p ≤ 0.05. Technical experimental replicates n = 3. (B) Increased sex specific activity in female 16pdel probands drives overall increased LFPs, compared to unaffected controls. Media unaffected neurons (Control) male (♂) n = 3, Control female (♀) n = 6,16pdel neurons (Proband) ♂ n = 21, Proband ♀ n = 14, Physiological Solution Control ♂ n = 7, Control ♀ n = 10, Proband ♂ n = 38, Proband ♀ n = 38, High KCl Solution Control ♂ n = 6, Control ♀ n = 7, Proband ♂ n = 18, Proband ♀ n = 17. Violin plot analysis: male versus female ttest. ∗∗∗∗p ≤ 0.0001. (C) Increased sex specific female electrogenic burst frequency analyzed by log2 fold change between 16pdel male and female Media ♂ n = 21, ♀ n = 14, Physiological Solution ♂ n = 38, ♀ n = 38, High KCl Solution ♂ = 18, ♀ n = 17. Violin plot analysis: male versus female ttest. ∗p ≤ 0.05. Technical experimental replicates n = 3. |
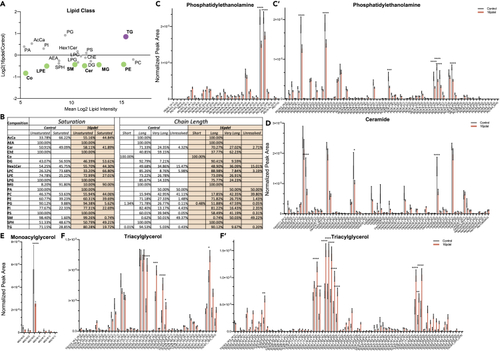
Significant lipid changes between control and 16pdel differentiated neurons (A) Total log2 fold change from normalized peak area of lipid class analysis from untargeted lipidomics. Bolded and colored indicate statistically significant changes by T test, p ≤ 0.05–0.0001. AcCa acyl carnitine, AEA N-arachidonoylethanolamine, Cer ceramide, ChE cholesterol ester, Co coenzyme, DG diacylglycerol, Hex1Cer hexosylceramide, LPC lysophosphatiylcholine, LPE lysophosphatiylethanolamine, LPG lysophosphatiylglycerol, MG monoacylglycerol, PA phosphatidic acid, PC phosphatidylcholine, PE phosphatidylethanolamine, PG phosphatidylglycerol, PI phosphatidylinositol, PS phosphatidylserine, SM sphingomyelin, SPH sphingosine, TG triacylglycerol. (B) Total lipid composition analysis from untargeted lipidomics between control and 16pdel neuron. Chain Length: Small 1–5, Medium 6–12, Long 13–21, Very Long 22+, and Unresolved. (C–F) Selected analysis of lipid species from untargeted lipidomics classes. Lipid Class specified for each histogram (c - phosphatidylethanolamine, (D) ceramide, (E) monoacylglycerol, (F) triacylglycerol) normalized peak area between control (gray) and 16pdel (orange). Statistical analysis by two-Way ANOVA, ∗p ≤ 0.05 ∗∗p ≤ 0.01,∗∗∗p ≤ 0.001, ∗∗∗∗p ≤ 0.0001. Control n = 10, 16pdel n= 69, error bars represent SEM. TG and PE long and very long chain species not shown as no significant differences were found by ANOVA. Technical experimental replicates n = 3. |
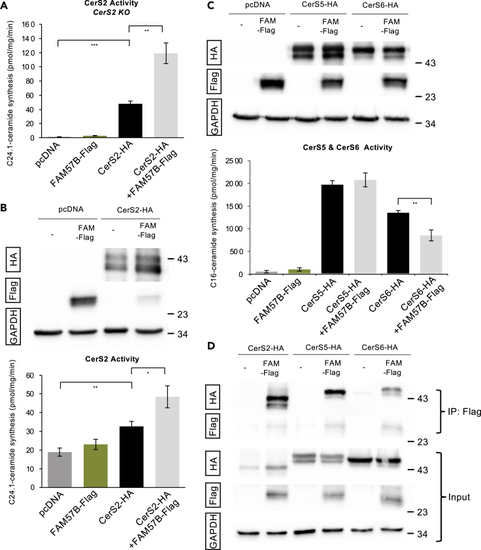
FAM57B interacts with CerS but does not have CerS activity (A) CerS2 activity assayed using C24:1-CoA in CerS2 KO HEK293T cells. Statistical analysis by ttest ∗p ≤ 0.05, ∗∗p ≤ 0.01, error bars SEM. Technical experimental replicates n = 3. (B) (Upper) Western blot analysis of total human FAM57B-Flag and CerS2-HA after transfection in HEK293T cells. Proteins were prepared from HEK293T cells overexpressing the indicated constructs. Anti-HA and anti-Flag are indicated. (Lower) CerS2 activity assayed using C24:1-CoA in HEK293T cells. GAPDH was used as a loading control. Statistical analysis by ttest ∗p ≤ 0.05, ∗∗p ≤ 0.01, error bars SEM. Technical experimental replicates n = 3. (C) (Upper) Western blot analysis of total human FAM57B-Flag, CerS5-HA and CerS6-HA after transfection in HEK293T cells. Proteins were prepared from cells overexpressing the indicated constructs. Anti-HA and anti-Flag are indicated. (Lower) CerS5 and CerS6 activity was assayed using C16:0-CoA in HEK293T cells. Anti-HA and anti-Flag are indicated. GAPDH was used as a loading control. Technical experimental replicates n = 4. (D) Total cell lysates were prepared from the co-transfected cells with FAM57B-Flag and CerS2, 5 or 6-HA constructs and solubilized with 1% NP-40. Total lysates (input) or proteins immuno-precipitated with anti-Flag M2 agarose (IP) were subjected to immunoblotting with anti-HA or anti-Flag antibodies. GAPDH was used as a loading control. Technical experimental replicates n = 3. |
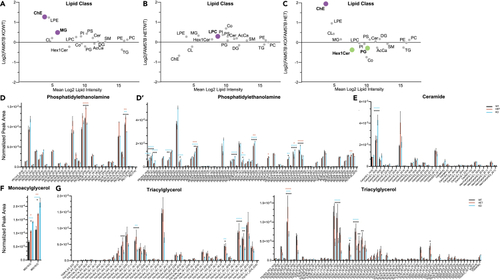
Significant lipid changes in sphingolipids and glycerolipids between WT and FAM57B mutant human differentiated SH-SY5Y neuronal cells (A–C) Total log2 fold change from normalized peak area of lipid class analysis from untargeted lipidomics. (A) FAM57B KO– WT, (B) FAM57B HET– WT, (C) FAM57B KO–FAM57B HET. Bolded and colored indicate statistically significant changes by ttest, p ≤ 0.05–0.0001. AcCa acyl carnitine, Cer ceramide, ChE cholesterol ester, CL cardiolipin, Co coenzyme, DG diacylglycerol, HexCerHexosylceramide, LPC lysophosphatiylcholine, LPE lysophosphatiylethanolamine, MG monoacylglycerol, PC phosphatidylcholine, PE phosphatidylethanolamine, PG phosphatidylglycerol, PI phosphatidylinositol, PS phosphatidylserine, SM sphingomyelin, TG triacylglycerol. Technical experimental replicates n = 3. (D–G) Selected analysis of lipid species from untargeted lipidomics classes. Lipid Class specified for each histogram, normalized peak area between WT (black) FAM57B HET (orange) and FAM57B KO (blue). Statistical analysis by two-Way ANOVA, ∗p ≤ 0.05 ∗∗p ≤ 0.01, ∗∗∗p ≤ 0.001, ∗∗∗∗p ≤ 0.0001. Color of asterisks indicate comparison between WT – HET (orange), WT – KO (blue), HET – KO (black). WT n = 3, FAM57B HET n= 3, FAM57B KO n = 3, error bars represent SEM. Experiment repeated twice; analysis was similar between two separate runs. |
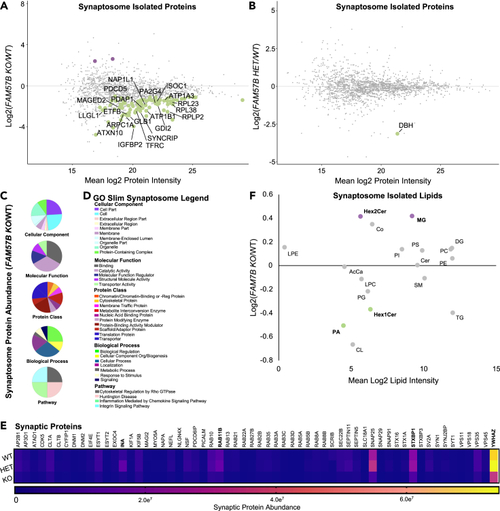
FAM57B knockout human neurons indicate altered synaptic composition (A and B) Isolated synaptosome protein abundance changes between (A) FAM57B KO relative to WT and (B) FAM57B HET relative to WT (Log2 Fold). Labeled and colored indicating increased (purple) or decreased (green) abundance. Only the top 20 proteins of statistical significance were labeled in A and analyzed in C-E. WT n = 8, HET n = 10, KO n = 7. Technical experimental replicates n = 3. (C–E) Gene ontology analysis of statistically significant synaptosome isolated proteins (E) in FAM57B KO relative to WT. (E) gene ontology pie graphs of top 20 decreased protein groups of cellular components, molecular function, protein classes, biological processes and pathways.(F) gene ontology figure legend. (G) Analysis of synaptic markers from isolated synaptosomes between all 3 genotypes. Bolded are significantly decreased protein abundance of synaptic structural and maturation proteins, and vesicle regulation machinery. INA – WT - HET & WT - KO, RAB11B – HET - KO, STXBP1 – WT - HET & WT - KO, YWHAZ – WT - HET & WT - KO. two-Way ANOVA, p ≤ 0.05–0.0001. (F) Isolated synaptosome lipid abundance between FAM57B KO relative to WT. Bolded text and color (purple increased and green decreased) indicates statistically significant changes by ttest, p ≤ 0.05–0.01. n = 6 per genotype, technical experimental replicates n = 2. No statistically significant differences observed when comparing FAM57B HET to WT, nor FAM57B KO to FAM57B HET. |
Significant lipid changes in ceramides and glycerols between AB and fam57b mut brain tissue (A) Total log2 fold change from normalized peak area of lipid class analysis from untargeted lipidomics. Bolded and colored indicate statistically significant changes by ttest, p ≤ 0.05–0.0001. AcCa acyl carnitine, Cer ceramide, ChE cholesterol ester, CL cardiolipin, Co coenzyme, DG diacylglycerol, HexCerHexosylceramide, LPC lysophosphatiylcholine, LPE lysophosphatiylethanolamine, MG monoacylglycerol, PC phosphatidylcholine, PE phosphatidylethanolamine, PG phosphatidylglycerol, PI phosphatidylinositol, PS phosphatidylserine, SM sphingomyelin, TG triacylglycerol. Technical experimental replicates n = 3. (B–H) Selected analysis of lipid species from untargeted lipidomics classes. Lipid Class specified for each histogram, normalized peak area between AB (gray) and fam57b mut (green). Statistical analysis by two-Way ANOVA, ∗p ≤ 0.05 ∗∗p ≤ 0.01,∗∗∗p ≤ 0.001, ∗∗∗∗p ≤ 0.0001. AB n = 3, fam57b mut n= 3, error bars represent SEM. Experiment repeated twice, analysis was similar between two separate runs. Individual MG species between fam57b het to AB n.s. Not shown for space: two-Way ANOVA analysis of TG. Increase in TG (16:0_16:0_16:1) in fam57b het compared to AB (p ≤ 0.01). PHENOTYPE:
|
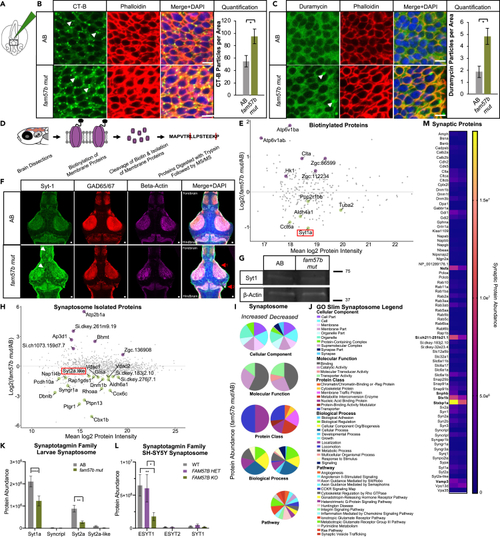
Loss of fam57b results in altered plasma membrane architecture early in development and decreased localization of Synaptotagmin family at the synapse later in development (A) Schematic of Cholera toxin-B-488 (CT-B) injection into hindbrain ventricle of embryo and flat-mounted midbrain region for imaging at 24 hpf. (B) Representative embryo midbrain imaging and quantification of CT-B labeling of AB compared to fam57b mut. Punctate CT-B labeling (arrows), actin marker phalloidin indicates labeling of CT-B at the plasma membrane, merged with DAPI. Quantification of puncta between WT (gray) and fam57b mut (green) CT-B (p ≤ 0.05) ttest. Scale bar = 5 μm. AB n = 16, fam57b mut n = 18. Error bars SEM, statistical analysis by ttest ∗p ≤ 0.05. Technical experimental replicates n = 4. (C) Representative embryo midbrain imaging and quantification of Duramycin-488 labeling of AB compared to fam57b mut. Punctate Duramycin labeling (arrows), actin marker phalloidin indicates labeling of Duramycin at the plasma membrane, merged with DAPI. Quantification of puncta between WT (gray) and fam57b mut (green) Duramycin PE staining (p ≤ 0.05) ttest. Scale bar = 5 μm. AB n = 8, fam57b mut n = 8. Error bars SEM, statistical analysis by ttest ∗p ≤ 0.05. Technical experimental replicates n = 3. (D) Schematic of membrane protein labeling biotinylation assay and processing for MS/MS in 7 dpf larvae brains. (E) Larvae brain total plasma membrane protein abundance changes between fam57b mut relative to AB (Log2 Fold). Statistically significant p ≤ 0.05–0.0001 proteins labeled, indicating increased (purple) or decreased (green) abundance. Lowest abundance membrane protein Synaptotagmin-1a (red box). n = 3 per genotype. (F) Representative slice of 7 dpf whole larva brain mount with Sytaptotagmin-1a (green), GAD65/67 (red) and Beta-actin (magenta). z stack composite image merged with DAPI. Forebrain and midbrain areas of diffused Syt-1 localization (white arrows). Anatomical differences noted throughout brain, including (1) optic tectum and (2) corpus cerebelli (red arrows). Scale bar = 10 μm. Technical experimental replicates n = 2. (G) Representative 7 dpf whole brain Western blot indicate no significant change in total Syt-1a protein levels between fam57b mut relative to AB. Zebrafish larvae brains pooled (20 per genotype). Syt-1a protein abundance normalized to Beta-Actin loading control, repeated twice. (H) Larvae brain total isolated synaptosome protein abundance changes between fam57b mut relative to AB (Log2 Fold). Statistically significant p ≤ 0.05–0.0001 proteins labeled, indicating increased (purple) or decreased (green) abundance. Low abundance Synaptotagmin-2a like protein (red box). n = 7 per genotype. Technical experimental replicates n = 2. (I and J) Gene ontology analysis of statistically significant larvae synaptosome isolated proteins (H) in fam57b mut relative to AB. (I) Gene ontology pie graphs of increased and decreased protein groups of cellular components, molecular function, protein classes, biological processes and pathways. (J) Gene ontology figure legend. (K) Analysis of Synaptotagmin family members from larvae isolated synaptosomes. Significantly decreased protein abundance of Syt1a and Syt2a by two-Way ANOVA, ∗∗p ≤ 0.01, ∗∗∗∗p ≤ 0.0001. (L) Analysis of Synaptotagmin family members from differentiated SH-SY5Y isolated synaptosomes between all 3 genotypes. Significantly decreased protein abundance of elongated ESYT1 by two-Way ANOVA, ∗p ≤ 0.05, ∗∗p ≤ 0.01. Error bars SEM. (M) Analysis of synaptic markers from larvae isolated synaptosomes. Significantly decreased protein abundance (bolded) of vesicle regulation machinery and glutamate receptor activity by two-Way ANOVA, ∗∗p ≤ 0.01, ∗∗∗∗p ≤ 0.0001. |
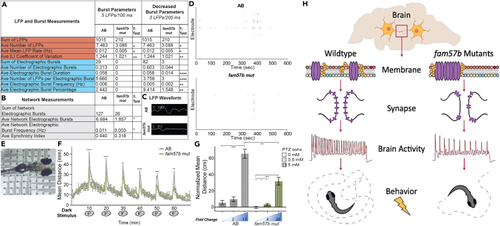
Decreased spontaneous brain activity and diminished behavioral response after stimuli presentation in fam57b mutants (A and B) Local field potential (LFP) recordings in unanesthetized live larvae at 7dpf. Brain localized LFP recordings were pooled for each larva. (A) Decreased average number, mean rate and inter-LFP interval (ILI) coefficient of variation of LFP in fam57b mut compared to AB (orange). No electrographic burst activity was identified in fam57b mut at standard 5 LFPs/100 ms. Decreased electrographic burst parameters, including duration, number of LFPs per burst, frequency and percentage at 3 LFPs/200ms (blue). (B) Decreased average electrographic burst network activity and frequency, defined as a minimum or 3 electrographic bursts between 2 electrodes simultaneously, in fam57b mut compared to AB (gray). AB n = 21, fam57b mut n = 24 over 6 experiments. Statistical significance by unpaired ttest, ∗p ≤0.05, ∗∗p ≤ 0.01,∗∗∗p ≤ 0.001,∗∗∗∗p ≤ 0.0001. Technical experimental replicates n = 7. (C) Representative LFP waveform in brain region, indicating smaller relative waveform in fam57b mut compared to AB. (D) Representative LFP raster plot over experimental time frame, indicating less overall activity in fam57b mut compared to AB. (E) Representative image of 7 dpf immersed in cooled agarose in contact with electrodes on 12-well CytoView MEA plate. (F) Startle response behavioral assay. Light source was removed for 5 s at 10 min intervals. Mean distance reported from tracked movement during 70 min assay. Decreased light startle response identified in fam57b mut compared to AB. Statistical analysis of each startle response by ttest ∗∗p ≤ 0.01, ∗∗∗p ≤ 0.001, ∗∗∗∗p ≤ 0.0001. Error bars SEM. No overall significant change in movement outside of the startle identified. AB n = 125, fam57b mut n = 33 over 5 experiments. (G) Seizure response behavioral assay. Normalized (baseline recording subtracted) mean distance from tracked movement after absence or presence of pentylenetetrazol (PTZ) 0.5 mM and 5 mM. Significantly increased seizure-induced movement observed at 5mM in AB, while increased movement observed at 0.5 and 5 mM PTZ in fam57b mut. Diminished overall seizure-induced movement at 5 mM in fam57b mut compared to AB. Relative fold change compared to absence of PTZ indicated below histogram. Statistical analysis of each condition by ttest ∗p≤ 0.05, ∗∗∗p ≤ 0.001, ∗∗∗∗p ≤ 0.0001. Error bars SEM. AB n = 166 (0 mM), 92 (0.5 mM), 150 (5 mM), fam57b mut n = 91 (0 mM), 70 (0.5 mM), 56 (5mM) over 6 experiments. (H) Model proposing role of Fam57b activity in the brain. Loss of function in fam57b mutants indicates significant changes in plasma membrane lipid groups alter architecture of plasma membrane early the developing brain. Architectural changes indicated by increased lipid raft abundance and aggregation. Altered plasma membrane homeostasis results in mis-localization of synaptic proteins, including synaptotagmins, after maturation. Decreased spontaneous brain and network activity suggests diminished synaptic function and developed circuits. As evidence has suggested spontaneous network activity shapes synaptic development, this cycles back to declined neuronal maturation and circuitry. Molecular changes to synaptic function and decreased spontaneous brain activity translate to altered behavioral response after stimuli presentation. PHENOTYPE:
|