
|
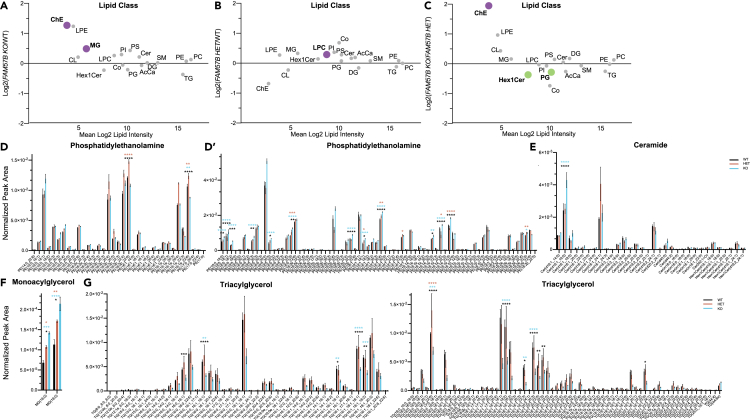
Fig. 4
Significant lipid changes in sphingolipids and glycerolipids between WT and FAM57B mutant human differentiated SH-SY5Y neuronal cells
(A–C) Total log2 fold change from normalized peak area of lipid class analysis from untargeted lipidomics. (A) FAM57B KO– WT, (B) FAM57B HET– WT, (C) FAM57B KO–FAM57B HET. Bolded and colored indicate statistically significant changes by ttest, p ≤ 0.05–0.0001. AcCa acyl carnitine, Cer ceramide, ChE cholesterol ester, CL cardiolipin, Co coenzyme, DG diacylglycerol, HexCerHexosylceramide, LPC lysophosphatiylcholine, LPE lysophosphatiylethanolamine, MG monoacylglycerol, PC phosphatidylcholine, PE phosphatidylethanolamine, PG phosphatidylglycerol, PI phosphatidylinositol, PS phosphatidylserine, SM sphingomyelin, TG triacylglycerol. Technical experimental replicates n = 3.
(D–G) Selected analysis of lipid species from untargeted lipidomics classes. Lipid Class specified for each histogram, normalized peak area between WT (black) FAM57B HET (orange) and FAM57B KO (blue). Statistical analysis by two-Way ANOVA, ∗p ≤ 0.05 ∗∗p ≤ 0.01, ∗∗∗p ≤ 0.001, ∗∗∗∗p ≤ 0.0001. Color of asterisks indicate comparison between WT – HET (orange), WT – KO (blue), HET – KO (black). WT n = 3, FAM57B HET n= 3, FAM57B KO n = 3, error bars represent SEM. Experiment repeated twice; analysis was similar between two separate runs.