
- Title
-
Simultaneous Tests of Theaflavin-3,3'-digallate as an Anti-Diabetic Drug in Human Hepatoma G2 Cells and Zebrafish (Danio rerio)
- Authors
- Zhou, H., Wu, Y., Kim, E., Pan, H., He, P., Li, B., Chen, Y.C., Tu, Y.
- Source
- Full text @ Nutrients
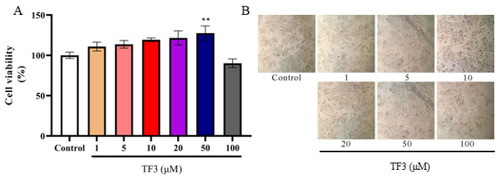
The effect of TF3 on HepG2 cell viability (A) and cell morphology (B). Control, DMEM medium culture; TF3, DMEM medium containing different concentrations of TF3 (1, 5, 10, 20, 50, 100 μM) treating for 24 h. ** p < 0.01 versus control group. |
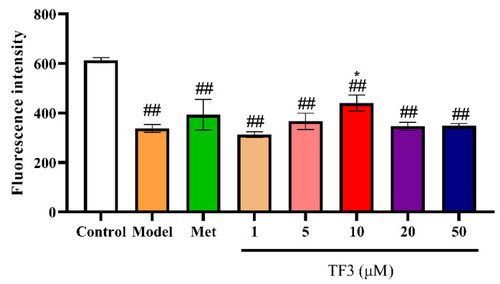
TF3 treatment recovered glucose uptake in glucose-treated insulin resistance HepG2 cells. Control, DMEM medium culture; model, DMEM medium with 500 μM glucose treating for 24 h; TF3, DMEM medium containing different concentrations of TF3 (1, 5, 10, 20, 50 μM) treating for 24 h after glucose-treatment; Met, DMEM medium containing metformin hydrochloride (10 μM) treating for 24 h after glucose-treatment. * p < 0.05 versus model group., ## p < 0.01 versus control group. |
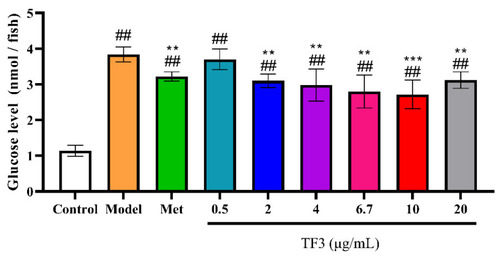
TF3 treatment reduced glucose level in zebrafish. Results were expressed as the mean ± SD (n = 5). Control, water culture; model, water with 1 μM alloxan and 4% glucose culture for 24 h; TF3, water with different concentrations of TF3 (0.5, 2, 4, 6.7, 10, and 20 μg/mL) treating for 24 h after alloxan-treatment; Met, water with metformin hydrochloride (10 μg/mL) treating for 24 h after alloxan-treatment. ## p < 0.01 versus control group. ** p < 0.01 versus model group, *** p < 0.001 versus Model group. |

TF3 inhibited alloxan-induced hyperglycemia via regulating PEPCK and GCK expression. (A) Blot results and (B) relative protein expression. Control, water culture; model, water with 1 μM alloxan and 4% glucose culture for 24 h; TF3, water with different concentrations of TF3 (2, 4, 10 μg/mL) treating for 24 h after alloxan-treatment; Met, water with metformin hydrochloride (10 μg/mL) treating for 24 h after alloxan-treatment. |
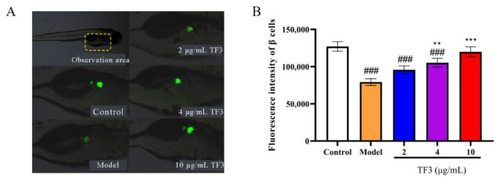
TF3 promoted β cell regeneration from alloxan-induced damage in zebrafish. (A) Fluorescence phenotype of zebrafish β cells and (B) the fluorescence intensity of β cells. Data were presented as the mean ± SD. Control, water culture; model, water with 1 μM alloxan and 4% glucose culture for 24 h; TF3, water with different concentrations of TF3 (0.5, 2, 4, 6.7, 10, and 20 μg/mL) treating for 24 h after alloxan-treatment. ### p < 0.001 versus control group, ** p < 0.01 versus model group, *** p < 0.001 versus model group. |