
- Title
-
Toxic Peptide From Palythoa caribaeorum Acting on the TRPV1 Channel Prevents Pentylenetetrazol-Induced Epilepsy in Zebrafish Larvae
- Authors
- Wang, X., Liao, Q., Chen, H., Gong, G., Siu, S.W.I., Chen, Q., Kam, H., Ung, C.O.L., Cheung, K.K., Rádis-Baptista, G., Wong, C.T.T., Lee, S.M.
- Source
- Full text @ Front Pharmacol
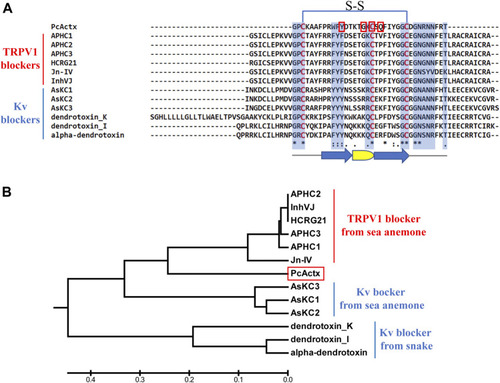
Multiple sequence alignment and phylogenetic analysis of PcActx peptide from P. caribaeorum. (A). Multiple sequence alignment of PcActx peptide and TRPV1 blockers originating from sea anemone, as well as Kv blockers originating from sea anemone and snake. Residues highlighted in blue are the key sites interacting with ion channels. Residues highlighted in red are the interactive sites of PcActx peptides binding to the TRPV1 channel. The arrow symbols represent β-sheet, and the semicircle represents β-turn. (B). Phylogenetic tree of PcActx peptide. |

MD simulation and structure comparison. (A). MD simulation of PcActx peptide monomer and dimmer. (B). Spatial structure of Cys 19 of PcActx peptide. Cys residues are shown as spheres in orange. Trp10, Tyr 12 and Phe 34 residues are shown as spheres in green. Other molecules are shown as cartoons in green. (C,D). Homology model structure of PcActx (C) and APHC1 (D) peptide. Molecules are shown as cartoons and colored based on the secondary structure: α-helix in purple, β-sheet in blue, β-turn in yellow, coil in gray, and disulfide bond in cyan. (E). Structure overlap of PcActx and APHC1. The structure of PcActx peptide is shown in green, and the structure of APHC1 peptide is shown in gray. |
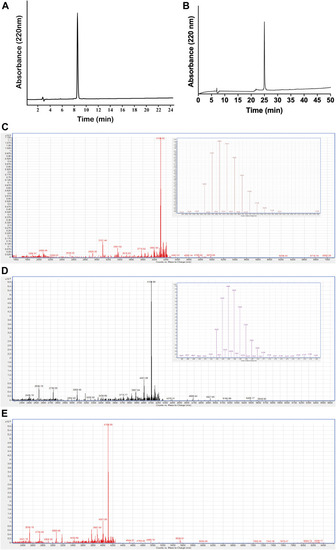
Purification and characterization of PcActx peptides. (A). Analytical RP-HPLC chromatograph for the final purified linear PcActx peptide with absorbance at 220 nm with purity ≥90%. (B). Analytical RP-HPLC chromatograph for the final purified oxidized PcActx peptide with absorbance at 220 nm with purity ≥90%. (C). ESI-MS analysis of linear PcActx peptide. Anal. calcd for C182H265N53O51S3 [M + H]+ 4104.89 Da (monoisotopic mass), found [M + H]+ 4104.90 Da. (D). ESI-MS analysis of oxidized PcActx peptide. Anal. calcd for C182H263N53O51S3 [M + H]+ 4102.87 Da (monoisotopic mass), found [M + H]+ 4102.88 Da. (E). ESI-MS analysis of oxidized PcActx peptide incubated in dd-H2O for 48 h. |
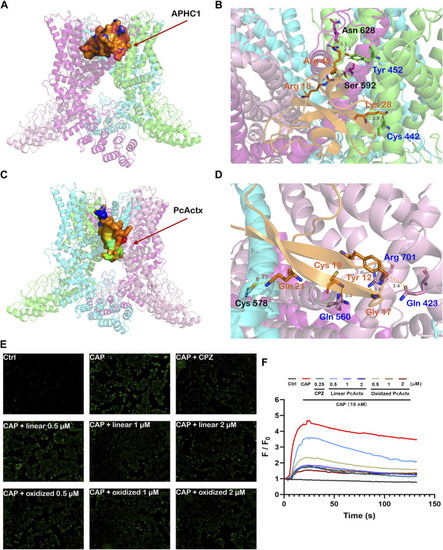
Peptide-protein docking analysis and fluorescent calcium measurement. (A). Side view of protein-peptide docking of the APHC1 peptide binding to the TRPV1 channel. The peptide is shown as a ribbon diagram colored in orange; the protein is shown as a cartoon. (B). Interface residues between APHC1 peptide and the TRPV1 channel. APHC1 peptide is shown in orange cartoon. In α chain, the hydrogen bonds are formed by Arg 18 and Arg 48 of APHC1 peptide with residue Ser 592 and Asn 628, respectively. In β chain, the hydrogen bonds are formed by Lys 28 and Arg 48 of APHC1 peptide with residue Cys 442 and Try 453, respectively. (C). Side view of protein-peptide docking of the PcActx peptide binding to the TRPV1 channel. The peptide is shown as a ribbon diagram colored in orange; the protein is shown as a cartoon. (D). Interface residues between PcActx peptide and the TRPV1 channel. PcActx peptide is shown in orange cartoon. The hydrogen bonds are formed by Tyr12, Gly17, Cys19, and Gln21 of PcActx peptide with residue Gln423, Arg701, Gln560 in γ chain, and Cys578 in δ chain of TRPV1, respectively. (E). Representative images of intracellular calcium concentration of HEK293-hTRPV1 cell (CAP: capsaicin; CPZ: capsazepine). (F). Representative time-dependent response of Ca2+ fluorescence intensity in each group. Ca2+ responses were measured as changes in fluorescence intensity of the representative average plots (n = 5) before (F0) and after capsaicin addition (F). (E,F) graphs represent a single representative experiment from a total of three independent experiments. |

Survival and behavioral toxicity of zebrafish larvae after 24 h exposure to PcActx peptides. (A) Linear PcActx peptide. (B). Oxidized PcActx peptide. (ⅰ) Survival rates of zebrafish larvae. Data were expressed as means ± SD (n = 3). (ⅱ). Representative patterns of locomotion behavior of zebrafish larvae. The swimming trajectory was recorded every 10 min and is represented by curves. The instantaneous velocity was detected and displayed in different colors (black, <2 mm/s; green, 2–8 mm/s; red, >8 mm/s). (ⅲ). Changes in total distance travelled by period. (ⅳ). Statistical analysis of total distance travelled. Data are expressed as means ± SD (n = 10–12). |
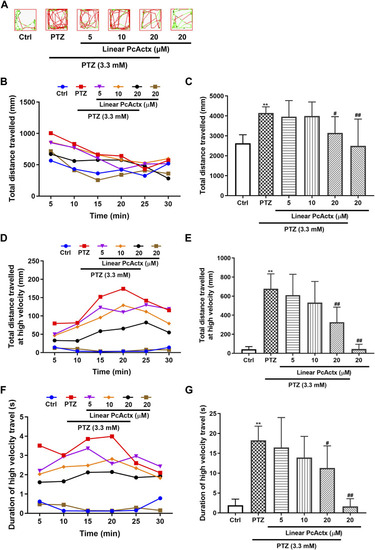
Linear PcActx peptide alleviated PTZ-induced seizure-related behavior in zebrafish larvae. (A) Representative patterns of behavioral locomotion in zebrafish larvae. The swimming trajectory was recorded every 5 min and is represented by curves. The instantaneous velocity was detected and displayed in different colors (black, <2 mm/s; green, 2–20 mm/s; red, >20 mm/s). (B). Changes in total distance travelled by period. (C). Statistical analysis of total distance travelled. (D). Changes in total distance travelled at high velocity by period (>20 cm/s). (E). Statistical analysis of total distance travelled at high velocity (>20 cm/s). (F). Changes in the duration of high velocity travel by period (>20 cm/s). (G). Statistical analysis of the duration of high velocity travel (>20 cm/s). Data are expressed as means ± SD (n = 9–10). * p < 0.05 vs Ctrl group, ** p < 0.01 vs Ctrl group, # p < 0.05 vs PTZ group, ## p < 0.01 vs PTZ group. PHENOTYPE:
|

Oxidized PcActx peptide inhibited PTZ-induced hyperactivity in zebrafish larvae. (A) Representative patterns of locomotion behavior in zebrafish larvae. The swimming trajectory was recorded every 5 min and is represented by curves. The instantaneous velocity was detected and displayed in different colors (black, <2 mm/s; green, 2–20 mm/s; red, >20 mm/s). (B). Changes in total distance travelled by period. (C). Statistical analysis of total distance travelled. (D). Changes in total distance travelled at high velocity by period (>20 cm/s). (E). Statistical analysis of total distance travelled at high velocity (>20 cm/s). (F). Changes in duration of high velocity travel by period (> 20 cm/s). (G). Statistical analysis of the duration of high velocity travel (>20 cm/s). Data are expressed as means ± SD (n = 9–10). * p < 0.05 vs Ctrl group, ** p < 0.01 vs Ctrl group, # p < 0.05 vs PTZ group, ## p < 0.01 vs PTZ group. PHENOTYPE:
|
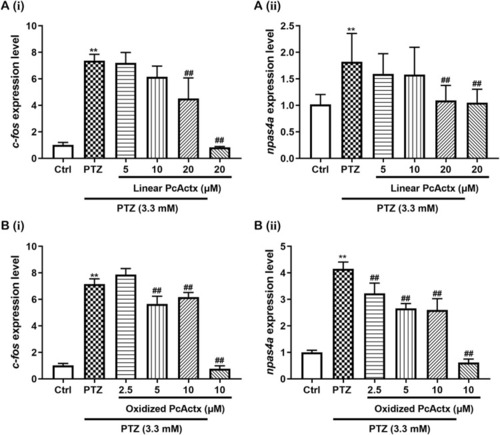
PcActx peptides prevented IER gene expression in PTZ-induced seizures of zebrafish. (A) Linear PcActx peptide. (B). Oxidized PcActx peptide. (ⅰ). c-fos expression level. (ⅱ). npas4a expression level. Data are expressed as means ± SD (n = 4–6). * p < 0.05 vs Ctrl group, ** p < 0.01 vs Ctrl group, # p < 0.05 vs PTZ group, ## p < 0.01 vs PTZ group. |
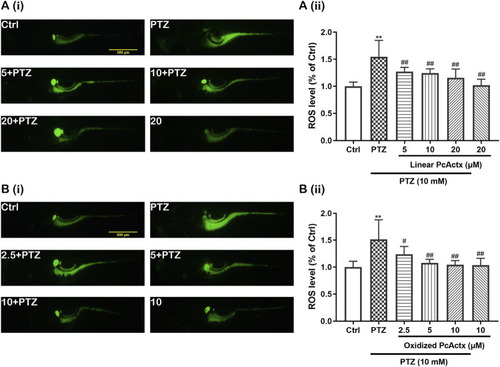
PcActx peptides attenuated PTZ-induced accumulation of ROS in zebrafish larvae. (A). Linear PcActx peptide. (B). Oxidized PcActx peptide. (i). Representative micrographs of fluorescence. (ii). Statistical analysis of ROS production. Data are expressed as means ± SD (n = 6–8). * p < 0.05 vs Ctrl group, ** p < 0.01 vs Ctrl group, # p < 0.05 vs PTZ group, ## p < 0.01 vs PTZ group. PHENOTYPE:
|
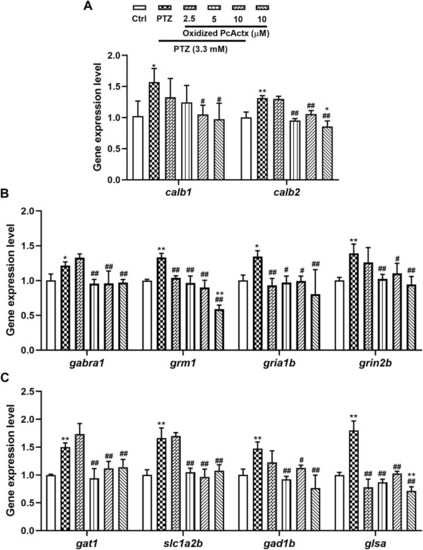
Oxidized PcActx peptide could regulate calcium and glutamatergic-GABAergic signaling related genes in PTZ-stimulated epileptic zebrafish. (A) calb1 and calb2 expression levels. (B). gabra1, grm1, gria1b and grin2b expression levels. (C). gat1, slc1a2b, gad1b and glsa expression levels. Data are expressed as means ± SD (n = 4). * p < 0.05 vs Ctrl group, ** p < 0.01 vs Ctrl group, # p < 0.05 vs PTZ group, ## p < 0.01 vs PTZ group. |
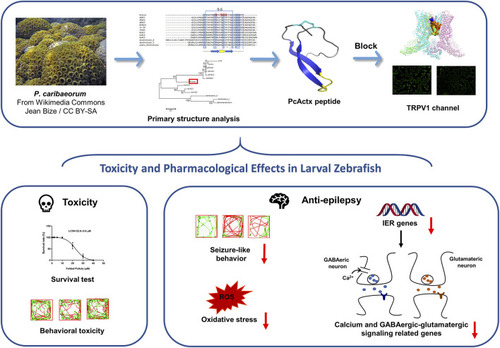
A schematic diagram. PcActx peptide from transcriptome of zoantharian P. caribaeorum exhibits prominent anti-epileptic activity, probably through modulating calcium signaling and GABAergic-glutamatergic signaling. |