
- Title
-
Genome-Wide Characterization of Zebrafish Endogenous Retroviruses Reveals Unexpected Diversity in Genetic Organizations and Functional Potentials
- Authors
- Bai, J., Yang, Z.Z., Li, H., Hong, Y., Fan, D.D., Lin, A.F., Xiang, L.X., Shao, J.Z.
- Source
- Full text @ Microbiol Spectr
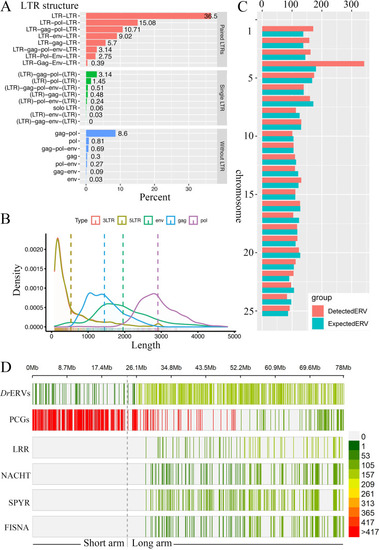
Structural characterization and genome distribution of DrERVs. (A) Structural elements and proportion statistics of DrERVs. LTR in parentheses (LTR) represents only single LTR existing at either end. (B) Length statistics of DrERVs. (C) Chromosome distribution of DrERVs. The expected ERV number was calculated by multiplying the chromosome length and whole genome average density of DrERV. The detected ERV number represents the number of actually identified DrERVs. (D) Distribution of PCGs, DrERVs, and NLR elements in chromosome 4. Dotted line indicates the boundary between the long arm and the short arm. |

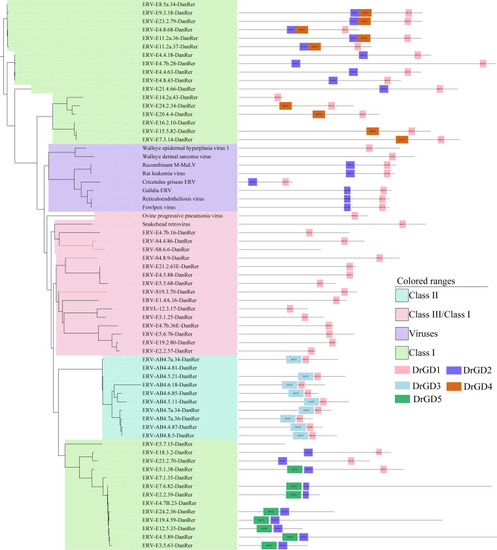
Phylogenetic tree of DrERV-like elements. (A) Phylogenetic analysis of DrERVs based on RT region. (B) Schematic diagram of the numbers and relationships between XRV-related DrERV groups. (C) Phylogenetic tree constructed using retrotrans_gag. (D) Phylogenetic tree constructed using the TLV_coat (HR1–HR2) domain. In (C) and (D), the DrERVs that have been classified as class I, class III, and gypsy by RT are annotated with purple, orange, and dark blue boxes, respectively; XRVs or ERVs from other species are annotated with light blue boxes; the newly identified DrERVs are annotated with red boxes. |
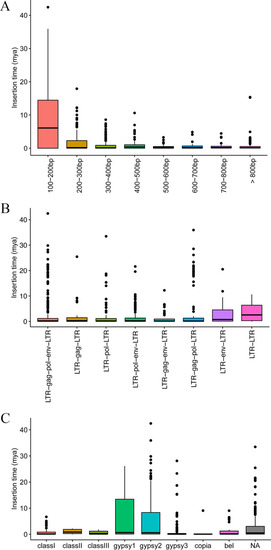
Prediction of insertion times of DrERVs. (A) The insertion times of DrERVs with different LTR length. (B) The insertion times of DrERVs with different structures. (C) The insertion times of DrERVs in different families. |
Phylogeny and predicted conserved domains of class I–III gag genes without retrotrans_gag domain. The left panel shows the phylogenetic tree constructed with gag sequences without predictable retrotrans_gag domain. Eight viruses or ERVs were used as references according to the BLAST results of class I–III gag genes without retrotrans_gag domain. The right panel shows the composition of the five predicted conserved domains in each elements. The length ratio between the lines refers to the actual sequence length ratio, and the positions of domains refer to their relative position in the unaligned sequences. |
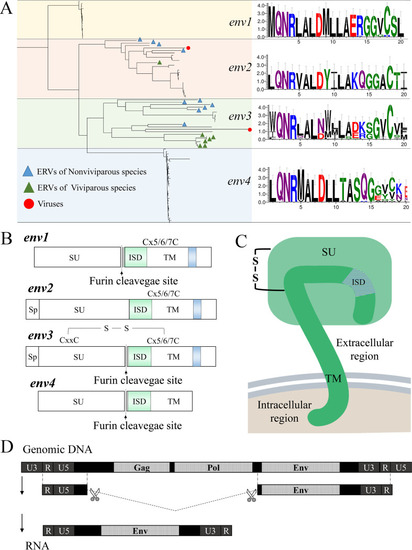
Classification and characteristic of env genes in DrERVs. (A) Phylogenetic tree of 71 env genes and diagrams of the ISD of four env groups. (B) Annotation of DrEnv1–4 protein groups, in which the representative elements are selectively shown. The ERV-E18.4b.4-DanRer of DrEnv4 does not follow this feature. (C) Pattern diagram of the structure of a representative Env protein located in the cell membrane. (D) Schematic diagram of the transcription and splicing of the env gene of ERV-E5.1.38-DanRer. |
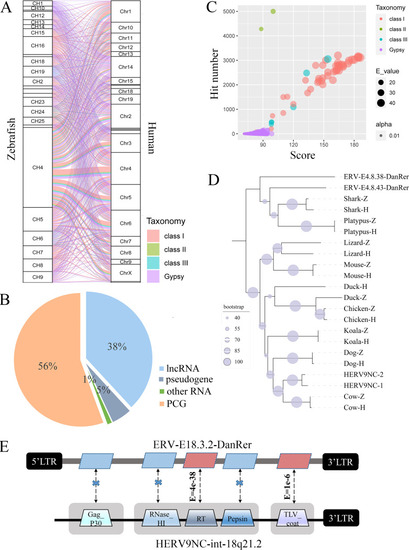
Comparative analysis of DrERVs and HERVs. (A) Chromosomal distribution of BLAST hits in human genome and query in zebrafish genome. (B) Composition of annotated genes that overlapped with RT BLAST hits. (C) Hit number, score, and E-value of BLAST hits generated by different DrERV classes. (D) Phylogenetic tree constructed by BLAST hits of HERV9NC-int and ERV-E4.8.43-DanRer in nine species. BLAST hits generated by RT sequences in HERV9NC-int and ERV-E4.8.43-DanRer are annotated by H and Z, respectively. (E) Comparison of the similarity between HERV9NC-int and ERV-E18.3.2-DanRer. |
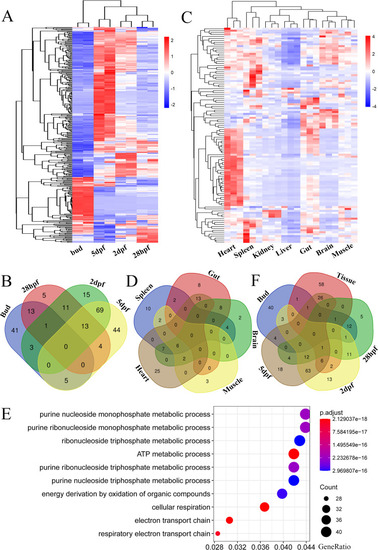
Transcriptional expression analysis of DrERVs during embryogenesis and in seven tissues. (A) Expression of DrERVs in four embryo developmental stages. (B) Venn diagram of the overlapping DrERVs among four embryonic stages. (C) Expression of DrERVs in seven tissues. (D) Venn diagram of the overlapping DrERVs among five tissues. Head kidney and liver tissues were excluded because none of the DrERVs expressed in these two tissues overlapped with the other tissues. (E) GO enrichment analysis of the genes co-expressed with heart-specific DrERVs. (F) Venn diagram of the overlapping DrERVs among four embryonic stages and adult tissues. Data from seven tissues were combined as a data set. |

Transcriptional expression analysis of DrERVs, IFN, and ISG under SVCV stimulation. (A) Upregulated expression of IFN and ISG genes in the spleen, head kidney, and gut tissues of zebrafish in response to SVCV infection (**, P < 0.01; ***, P < 0.001). (B) Transcriptional expression analysis of DrERVs in the spleen, head kidney, and gut tissues of zebrafish upon SVCV infection. |
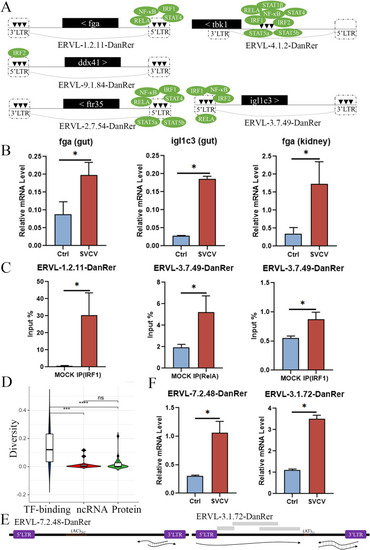
Potential regulatory elements and transcriptional expression analysis of DrERVs upon SVCV infection. (A) Schematic diagram of the potential TF-binding sites at the LTRs of DrERVs inserted with different functional genes that were actively expressed in response to SVCV stimulation. These DrERVs are designated as virus-responsive ERVs (VREs), and their associated functional genes are named as VRE-aid genes. The positional relationship between VREs and VRE-aid genes is shown. (B) Transcriptional expression analysis of two representative VRE-aid genes in head kidney and gut tissues upon SVCV infection. (C) Examination of the TF-binding activity of two representative TFs (IRF1 and RelA) at the LTRs of two VREs by ChIP–qPCR analysis. (D) Comparison of the sequence diversity of LTRs among different VRE types. (E) Schematic diagram of two typical noncoding VREs and the transcripts. The gray box represents the additional LTRs detected inside the DrERVs. (F) Expression analysis of noncoding VREs upon SVCV stimulation (*, P < 0.05; ***, P < 0.001; ****, P < 0.0001; ns, no significant difference). |