
|
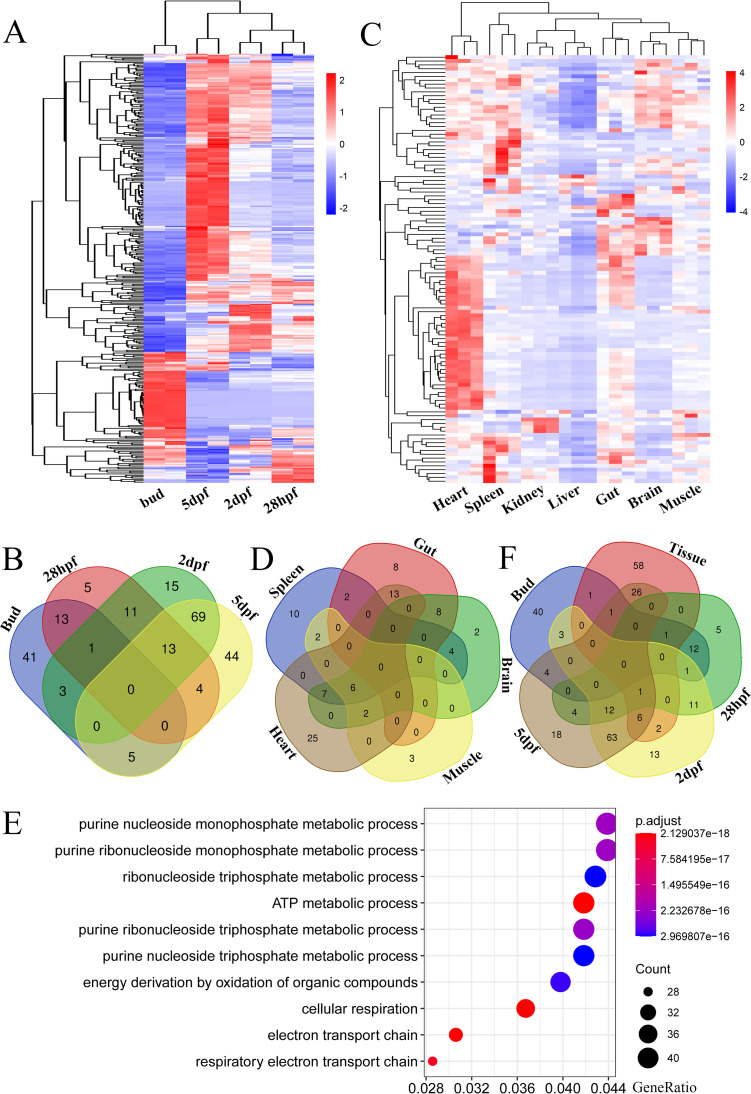
FIG 7
Transcriptional expression analysis of DrERVs during embryogenesis and in seven tissues. (A) Expression of DrERVs in four embryo developmental stages. (B) Venn diagram of the overlapping DrERVs among four embryonic stages. (C) Expression of DrERVs in seven tissues. (D) Venn diagram of the overlapping DrERVs among five tissues. Head kidney and liver tissues were excluded because none of the DrERVs expressed in these two tissues overlapped with the other tissues. (E) GO enrichment analysis of the genes co-expressed with heart-specific DrERVs. (F) Venn diagram of the overlapping DrERVs among four embryonic stages and adult tissues. Data from seven tissues were combined as a data set.