
- Title
-
Alginate-Capped Silver Nanoparticles as a Potent Anti-mycobacterial Agent Against Mycobacterium tuberculosis
- Authors
- Chen, C.C., Chen, Y.Y., Yeh, C.C., Hsu, C.W., Yu, S.J., Hsu, C.H., Wei, T.C., Ho, S.N., Tsai, P.C., Song, Y.D., Yen, H.J., Chen, X.A., Young, J.J., Chuang, C.C., Dou, H.Y.
- Source
- Full text @ Front Pharmacol
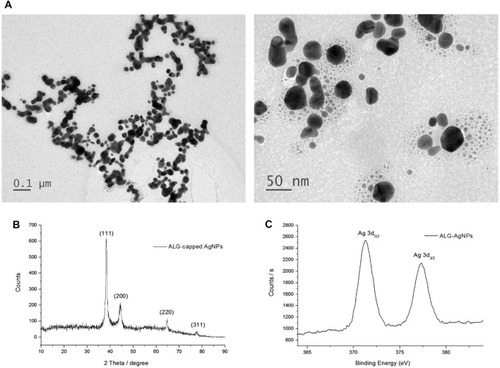
Characterization of ALG-AgNP physical and chemical properties. |

ALG-AgNPs have potential anti-mycobacterium activity against various pathogenic strains of Mycobacterium tuberculosis in vitro. (A) Schematic diagram of the Alamar blue assay employed for MIC determination. (B) MICs of ALG-AgNPs determined for different strains of Mtb. The data represent mean ± SEM of 3 experiments. MIC: minimum inhibitory concentration; MDR: multidrug-resistant TB; XDR: extensively drug-resistant TB. |
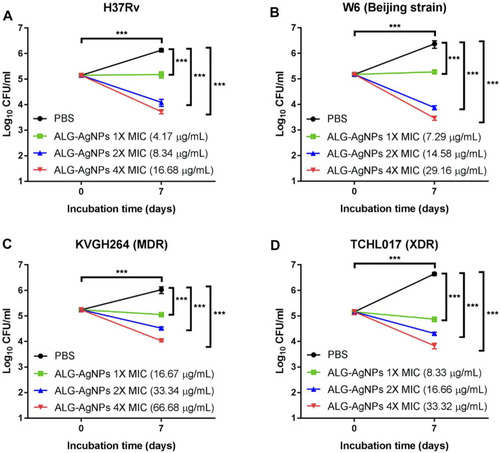
The biocidal action of ALG-AgNPs against different Mtb strains measured as a suppression of colony numbers relative to PBS treatment (control). Four Mtb strains were incubated with PBS or different amounts of ALG-AgNPs for 0 and 7 days. Bacterial growth was determined by counting the colony forming units (CFU) of (A) H37Rv (standard reference strain), (B) W6 (Beijing strain), (C) KVGH264 (MDR), and (D) TCHL017 (XDR). MDR: Multidrug-resistant TB; XDR: extensively drug-resistant TB. The data are expressed as log10 CFU/ml and represent the mean ± SEM of 3 experiments. ***p < 0.001. |

ALG-AgNPs significantly inhibit the growth of cytosolic Mycobacterium tuberculosis in a macrophage infection model. (A) Schematic diagram of the experimental procedures. (B–E) THP-1 cells were differentiated into macrophages by PMA stimulation for 3 days, then infected with different strains of Mtb at a MOI of 1 for 24 h. After treatment with PBS, or different amounts of ALG-AgNPs (25, 50, and 100 μg/ml), or rifampicin (RIF) (1 μg/ml) for 5 days, the cells were lysed and plated on 7H10 agar plates. The bacterial growth was determined by CFU of (B) H37Rv, (C) W6 (Beijing strain), (D) KVGH264 (MDR), and (E) TCHL017 (XDR). MDR: Multidrug-resistant TB; XDR: extensively drug-resistant TB. Data represent mean ± SEM of 3 experiments. ***p < 0.001. |
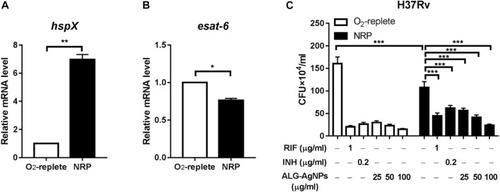
ALG-AgNPs effectively suppressed the growth of dormant-like bacilli in vitro. (A–B) The Mtb strain H37Rv was cultured with or without hypoxia to induce non-replicating persistence (NRP) or not. Then, the gene expression levels associated with the NRP state were assessed by QPCR, specifically (A) hspX and (B) esat-6. (C) The bacteria were treated with PBS, rifampicin (RIF) (1 μg/ml), isoniazid (INH) (0.2 μg/ml), or different amounts of ALG-AgNPs (25, 50, and 100 μg/ml) in the NRP state or not (O2-replete) for 5 days. The bacterial growth was determined by CFU analysis on Middlebrook 7H10 agar and expressed as the number of CFU |

ALG-AgNPs exert their biocidal action against Mycobacterium tuberculosis via an increase in bacterial cell-wall permeability. Log phase Mtb H37Ra cells were treated with or without 50 μg/ml ALG-AgNPs for 24 h. Then, the bacteria were stained with propidium iodide. The images were observed at 400× magnification by fluorescence microscopy. Scale bar represents 100 μm. |

ALG-AgNPs are a safe and effective therapeutic drug in zebrafish and mouse TB animal models. (A–C) After microinjection of M. marinum-DsRed into the caudal vein of zebrafish larvae, the infected larvae (5 fish/group/experiment) were treated with PBS, 100 μg/ml rifampicin (RIF) or 200 μg/ml ALG-AgNPs for 5 days. All data for zebrafish were from two experiments. (A) At 5 days post infection (dpi), the red fluorescence signal from M. marinum-DsRed infection was observed by fluorescence microscopy. Scale bar represents 1 mm. (B) The fluorescence signals of M. marinum-DsRed from zebrafish larvae treated with PBS (n = 10), rifampicin (n = 10) or ALG-AgNPs (n = 10) were quantified using ImageJ software and expressed as fluorescence pixels per larvae. (C) For determination of bacterial burdens, five fish/group/experiment were pooled together and homogenized in 1 ml PBS containing 1% SDS. The bacterial burdens of homogenates from infected larvae were diluted 10 |