
- Title
-
Mechanisms underlying microglial colonization of developing neural retina in zebrafish
- Authors
- Ranawat, N., Masai, I.
- Source
- Full text @ Elife
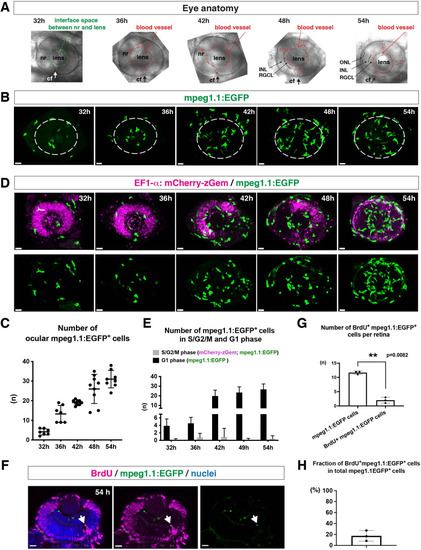
(A) Lateral view of zebrafish eyes used for confocal scanning shown in panel (B). Anterior is left and dorsal is up. The choroid fissure (cf, arrows) is formed at the ventral retina. At 32 hpf, the interface space between the neural retina (nr) and lens appears, in which ocular blood vessels are formed after 36 hpf. At 48 hpf, RGCL and INL are distinct. At 54 hpf, the ONL becomes evident. (B) Three-dimensional confocal images of mpeg1.1:EGFP-positive microglial precursors (green) in the retina from 32 to 54 hpf. Dotted circles indicate the outline of the optic cup. The first microglial precursors appear in the choroid fissure and near the lens at 32 hpf. Microglial precursors in the optic cup progressively increase in number. At 42 hpf, they start to enter retinal tissue and spread into the entire neural retina by 54 hpf. Scale: 30 µm. (C) Histogram of the number of intraocular microglial precursors from 32 to 54 hpf. Horizonal and vertical bars indicate means ± SD. (D) Three-dimensional confocal images of Tg[EF1α:mCherry-zGem; mpeg1.1:EGFP] retinas from 32 to 54 hpf. Tg[EF1α:mCherry-zGem] (magenta) indicates cells undergoing S and G2 phases. mpeg1.1:EGFP-positive microglial precursors (green) are mostly negative for mCherry-zGem, suggesting that most ocular microglial precursors are in G1 phase. Scale: 30µm. (E) Histogram of numbers of intraocular microglial precursors expressing only mpeg1.1:EGFP, and microglial precursors expressing both mCherry-zGem and mpeg1.1:EGFP in retinas from 32 to 54 hpf. Double-positive microglial precursors represent proliferating microglial precursors undergoing S/G2 phase. Single mpeg1.1:EGFP-positive microglial precursors represent microglial precursors in G1 phase. Bars and lines indicate means ± SD. (F) Sections of Tg[mpeg1.1:EGFP] transgenic retinas with BrdU incorporated and labeled with anti-BrdU (magenta) and anti-EGFP (green) antibody. Nuclei were counterstained by TOPRO3 (blue). The arrowhead indicates BrdU- and mpeg1.1:EGFP double-positive cells. Most mpeg1.1:EGFP+ cells are BrdU-negative at 54 hpf, suggesting that they are not proliferative. Scale: 20 µm. (G) Histogram of numbers of mpeg1.1:EGFP+ cells and BrdU-positive mpeg1.1:EGFP+ cells per retinal section. Bars and lines indicate means ± SD. **p < 0.01. (H) Fraction of BrdU-positive proliferative mpeg1.1:EGFP+ cells in total mpeg1.1:EGFP+ cells. The average is less than 20%, indicating that more than 80 % of ocular microglial precursors are in the G1 phase. Bars and lines indicate means ± SD.
|
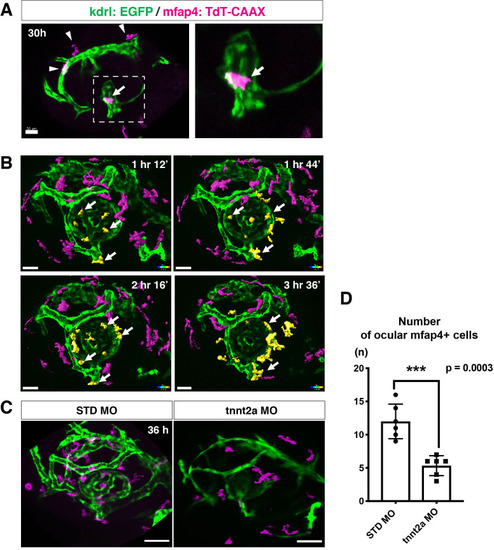
(A) Live confocal images of Tg[kdrl:EGFP; mfap4:tdTomato-CAAX] retinas at 30 hpf. Microglial precursors and blood vessels are visualized using fluorescence of mfap4tdTomato-CAAX (magenta) and kdrl:EGFP (green), respectively. Higher magnification image of a dotted square in the left panel is shown in the right panel. The first microglial precursor (arrow) approaches along developing hyaloid blood vessels near the lens through the choroid fissure. Arrowheads indicate peripheral macrophages outside the optic cup. Scale bar: 30 μm. (B) Time-lapse 3D snapshots of Tg[kdrl:EGFP; mfap4:tdTomato-CAAX] eyes for around 3.5 hr after 32 hpf. Ocular microglial precursors and peripheral macrophages outside the optic cup are indicated as yellow- and magenta-colored, surface-rendered objects, respectively, which were prepared from the original scanning image (Figure 2—figure supplement 1). Ocular blood vessels are visualized in green. Microglia associated with hyaloid blood vessels around the lens (white arrows) gradually increase and infiltrate neurogenic retinal tissue (Video 3). Scale bar: 30 μm. (C) Live 3D images of eyes of Tg[kdrl:EGFP; mfap4:tdTomato-CAAX] embryos injected with standard MO and tnnt2a MO. kdrl:EGFP-positive blood vessels (green) are thinner in tnnt2a morphants. Scale bar: 50 μm. (D) Histogram of the number of intraocular microglial precursors in embryos injected with standard MO and tnnt2a MO. Bars and lines indicate means ± SD. ***p < 0.001.
|
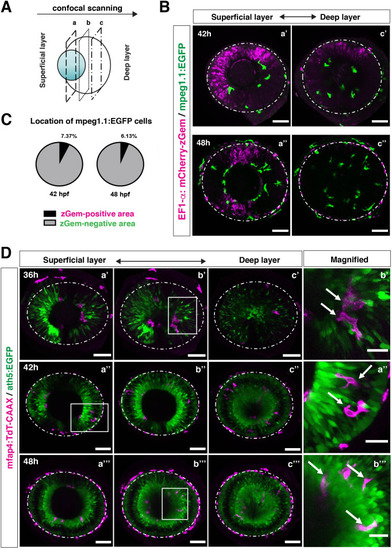
(A) Schematic drawing of confocal scanning planes (superficial, middle, and deep layers) in the optic cup shown in (B) and (D). (B) Live images of Tg[EF1α:mCherry-zGem; mpeg1.1:EGFP] retinas at 42 hpf (upper panels) and 48 hpf (lower panels). Two levels of confocal scanning planes are indicated as superficial (a’, a’’) and deep positions (c’, c’’). mpeg1.1:EGFP positive microglial precursors avoid mCherry-zGem positive proliferating retinal cell area. Scale bar: 50 μm. (C) Histogram of the fraction of microglial precursors associated with the mCherry-zGem-positive area (black) and the mCherry-zGem-negative area (grey). The fraction of microglial precursors associated with the mCherry-zGem-positive area is only 7.37 % at 42 hpf and 6.13 % at 48 hpf. Thus, more than 90 % of microglial precursors are located in the mCherry-zGem-negative retinal area. (D) Live images of Tg[ath5:EGFP; mfap4:tdTomato-CAAX] retinas at 36 (upper panels), 42 (middle panels) and 48 hpf (bottom panels). Three confocal scanning plane levels are indicated as superficial (a’-a”’), middle (b’-b”’), and deep (c-c”’). Dotted circles indicate the outline of the optic cup. The right-most column images indicate higher magnification images shown in the square of left panels. mfap4-positive microglia (magenta, arrows) are closely associated with ath5-positive neurogenic cells (green). Scale bar: 50 μm, except the right-most column images (Scale bar: 15 μm).
|
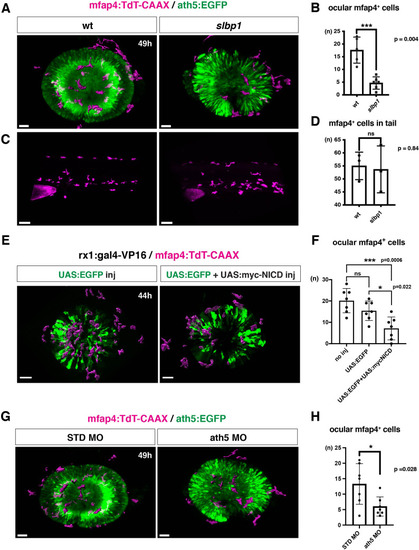
(A) Live 3D images of wild-type and slbp1 mutant retinas with Tg[mfap4:tdTomato-CAAX; ath5:EGFP] at 49 hpf. Only mfap4:tdTomato-CAAX-positive ocular microglial precursors and peripheral macrophages are shown as surface-rendered objects. Original images are shown in Figure 4—figure supplement 2A. Scale bar: 30 μm. (B) Histogram of numbers of ocular microglial precursors in slbp1 mutants and wild-type siblings. mfap4-positive microglial precursors are significantly fewer in slbp1 mutants. Bars and lines indicate means ± SD. ***p < 0.001. (C) Live 3D images of wild-type and slbp1 mutant trunk with Tg[mfap4:tdTomato-CAAX; ath5:EGFP] at 49 hpf. Scale bar: 70 μm. (D) Histogram of numbers of trunk macrophages in slbp1 mutants and wild-type siblings. There is no significant difference in mfap4-positive macrophage number in trunks of slbp1 mutants. Bars and lines indicate means ± SD. (E) Live 3D images of retinas of Tg[rx1:gal4-VP16; mfap4:tdTomato-CAAX] embryos injected with one DNA construct encoding UAS:EGFP (left) or two DNA constructs encoding UAS:EGFP; UAS:myc-tagged NICD (right) at 44 hpf. Only mfap4:tdTomato-CAAX-positive ocular microglial precursors and peripheral macrophages are shown as surface-rendered objects. Original images are shown in Figure 4—figure supplement 2B. Scale bar: 30 μm. (F) Histogram of numbers of ocular microglial precursors in rx1:gal4-VP16; UAS:EGFP expressed and rx1:gal4-VP16; UAS:EGFP; UAS:myc-NICD expressed wild-type retinas. mfap4-positive microglia are significantly decreased in myc-NICD expressed retinas, compared with non-injection control and EGFP expressed control retinas. Bars and lines indicate means ± SD. *P < 0.05, ***P < 0.001. (G) Live 3D images of standard MO- and ath5 MO-injected retinas of Tg[mfap4:tdTomato-CAAX; ath5:EGFP] embryos at 49 hpf. Only mfap4:tdTomato-CAAX-positive ocular microglial precursors and peripheral macrophages are shown as surface-rendered objects. Original images are shown in Figure 4—figure supplement 2C. Scale bar: 30 μm. (H) Histogram of numbers of ocular microglial precursors in standard MO and ath5 MO-injected wild-type retinas. mfap4-positive microglial precursors are significantly less numerous in ath5 morphant retinas. Bars and lines indicate means ± SD. *p < 0.05.
|
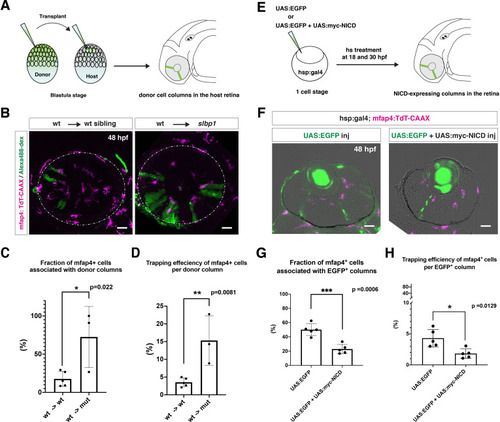
(A) Schematic drawing of cell transplantation experiments. Wild-type donor embryos are labeled with Alexa-448-dextran and transplanted into slbp1 mutant recipient embryos at blastula stage. In slbp1 mutant recipient embryos, transplanted wild-type donor cells form retinal cell columns. The host slbp1 mutant line is combined with Tg[mfap4:tdTomato-CAAX], to investigate whether mfap4-positive microglial precursors (magenta) infiltrate the neural retina preferentially through Alexa-448-dextran-labeled, wild-type donor columns (green) in slbp1 mutant recipient embryos. (B) Live images of slbp1 mutant retinas with transplanted wild-type donor retinal cell columns at 48 hpf. Donor wild-type retinal cell columns are labeled with Alexa-488 dextran (green). Host microglial precursors are visualized with the transgene Tg[mfap4:tdTomato-CAAX] (magenta). Dotted circles indicate the outline of the optic cup. Many microglial precursors are associated with wild-type donor retinal columns in slbp1 mutant host retinas (right panel), compared with wild-type sibling host retinas (left panel). Scale bar: 30 μm (C) The fraction of mfap4-positive microglial precursors associated with donor transplanted retinal cell columns versus the total number of microglial precursors in the optic cup. The average fraction of mfap4-positive cells associated with donor retinal cell columns is significantly higher in slbp1 mutant host retinas than in wild-type host retinas. Bars and lines indicate means ± SD. *p < 0.05. (D) The trapping efficiency of mfap4-positive microglial precursors per donor column. The average trapping efficiency is significantly higher in slbp1 mutant host retinas than in wild-type host retinas, suggesting higher affinity of microglial precursors for neurogenic retinal cells. Bars and lines indicate means ± SD. **p < 0.01. (E) Schematic drawing of mosaic expression of NICD in retinas. A mixture of UAS:EGFP and UAS-myc-NICD plasmids was injected into fertilized eggs of the Tg[hsp:gal4; mfap4:tdTomato] transgenic line, which were treated by heat shock at 18 and 30 hpf. At 48 hpf, embryos were fixed to prepare serial retinal sections for imaging analysis. (F) Confocal scanning of retinal sections of Tg[hsp:gal4; mfap4:tdTomato] transgenic embryos injected with plasmids encoding UAS:EGFP or UAS:EGFP+ UAS:myc-NICD. Scale bar: 30 μm. (G) The fraction of mfap4-positive microglial precursors associated with EGFP-expressing retinal cell columns versus the total number of microglial precursors in the optic cup. The average fraction of mfap4-positive cells associated with EGFP-positive retinal columns is significantly lower in retinas injected with UAS:EGFP+ UAS:myc-NICD than with only UAS:EGFP control. Bars and lines indicate means ± SD. ***p < 0.005. (H) The trapping efficiency of mfap4-positive microglial precursors per EGFP-expressing retinal cell columns. The average trapping efficiency is significantly lower in retinas injected with UAS:EGFP+ UAS:myc-NICD than with only UAS:EGFP control, suggesting less affinity of microglial precursors for proliferative NICD-expressing retinal cells. Bars and lines indicate means ± SD. *p < 0.05.
|
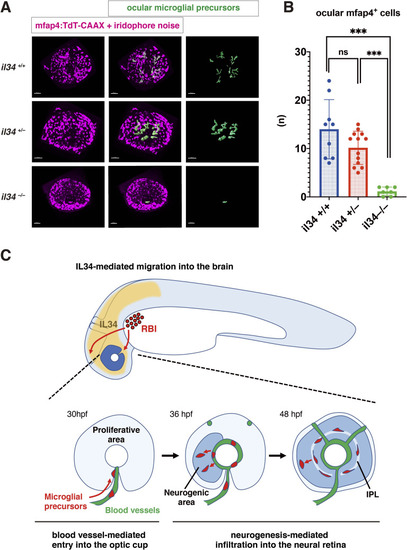
(A) Confocal 3D scanning of 48 hpf wild-type, il34 heterozygous and homozygous mutant retinas carrying the Tg[mfap4:tdTomato-CAAX] transgene. At 48 hpf, iridophores start to differentiate around the optic cup, which causes a noise signal (magenta) in confocal scanning. Using the surface-rendering tool of Imaris software (Bitplane), we eliminated iridophore-derived noise and extracted mfap4:tdTomato-CAAX signals from ocular microglial precursors (green) (see the legend of Figure 4—figure supplement 3). Scale bar: 50 μm. (B) Histogram of numbers of ocular microglial precursors in wild-type, il34 heterozygous and homozygous mutant retinas at 48 hpf. The number of ocular microglial precursors is almost zero, and very few, if any (one or two), in il34 homozygous mutants, indicating that ocular microglial precursors are significantly reduced in il34 homozygous mutants. The number of ocular microglial precursors is mildly reduced in il34 heterozygous mutants, but does not differ significantly from that of wild-type siblings. Bars and lines indicate means ± SD. ***p < 0.005. (C) A possible model of the guidance mechanism of microglial precursor into zebrafish retina. IL34 is involved in movement of microglial precursors toward the brain. Microglial precursors continue into the optic cup along blood vessels, and subsequently infiltrate the neural retina through the neurogenic area.
|