
|
Figure 3
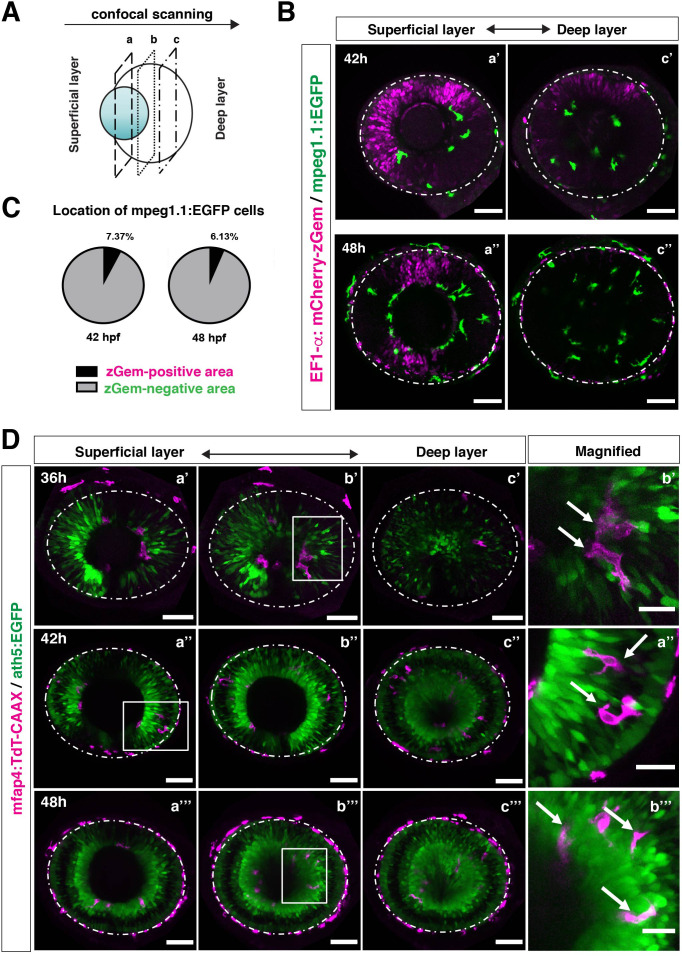
(A) Schematic drawing of confocal scanning planes (superficial, middle, and deep layers) in the optic cup shown in (B) and (D). (B) Live images of Tg[EF1α:mCherry-zGem; mpeg1.1:EGFP] retinas at 42 hpf (upper panels) and 48 hpf (lower panels). Two levels of confocal scanning planes are indicated as superficial (a’, a’’) and deep positions (c’, c’’). mpeg1.1:EGFP positive microglial precursors avoid mCherry-zGem positive proliferating retinal cell area. Scale bar: 50 μm. (C) Histogram of the fraction of microglial precursors associated with the mCherry-zGem-positive area (black) and the mCherry-zGem-negative area (grey). The fraction of microglial precursors associated with the mCherry-zGem-positive area is only 7.37 % at 42 hpf and 6.13 % at 48 hpf. Thus, more than 90 % of microglial precursors are located in the mCherry-zGem-negative retinal area. (D) Live images of Tg[ath5:EGFP; mfap4:tdTomato-CAAX] retinas at 36 (upper panels), 42 (middle panels) and 48 hpf (bottom panels). Three confocal scanning plane levels are indicated as superficial (a’-a”’), middle (b’-b”’), and deep (c-c”’). Dotted circles indicate the outline of the optic cup. The right-most column images indicate higher magnification images shown in the square of left panels. mfap4-positive microglia (magenta, arrows) are closely associated with ath5-positive neurogenic cells (green). Scale bar: 50 μm, except the right-most column images (Scale bar: 15 μm).
Microglial precursors infiltrate the retina through the neurogenic area.