
- Title
-
Cell-Penetrating Delivery of Nitric Oxide by Biocompatible Dinitrosyl Iron Complex and Its Dermato-Physiological Implications
- Authors
- Chen, Y.C., Chen, Y.H., Chiu, H., Ko, Y.H., Wang, R.T., Wang, W.P., Chuang, Y.J., Huang, C.C., Lu, T.T.
- Source
- Full text @ Int. J. Mol. Sci.

Kinetics and efficacy study of NO-release reactivity of [Fe2(μ-SCH2CH2COOH)2(NO)4] (DNIC-2). Time-dependent change of UV-vis spectra for DNIC-2 in MEM (a) with and (b) without the presence of 10% FBS. The arrows indicate the time-dependent change of the UV-vis spectra. (c) Decompositions of DNIC-2 in MEM with (black) and without (blue) the presence of 10% FBS, respectively, which were fitted to pseudo-first-order kinetics. Data show the mean ± SD from three independent experiments. (d) Half-life for decomposition of DNIC-2 in MEM with or without the presence of 10% FBS at 37 °C. Data represent the mean ± SD (n = 3). (e) Equivalent of released nitric oxide during degradation of DNIC-2. The data are the mean values ± SD pooled from six independent experiments. (f) Time-dependent change of relative fluorescence intensity of NO-specific probe DAF-FM (excitation at 495 nm and emission at 535 nm) with the treatment of 50 μM of DNIC-2 (black) or 133 μM of NONOate (red) in MEM with 10% FBS, which were fitted to pseudo-first-order kinetics. Data show the mean ± SD from three independent experiments. (g) EPR spectra for DNIC-2 in MEM with (black) and without (blue) the presence of 10% FBS, respectively. |

Cellular uptake of DNIC-2 and intracellular release of nitric oxide in human skin fibroblast (CCD-966SK) cells. (a) Cell viability assay of the human skin fibroblast (CCD-966SK) cells treated with different concentrations of DNIC-2 for 24 h **** p < 0.001 compared to the group without treatment of DNIC-2. (b) Representative EPR spectra for CCD-966SK cells treated with 50 μM of DNIC-2 for 0 h (black) and 1 h (red). (c) Formation and decay of protein-bound DNIC in CCD-966SK cells after treatment of 50 μM of DNIC-2 for 0, 0.5, 1, 4, and 8 h. (d) Fluorescence images of CCD-966SK cells treated with DAF-FM (10 μM) for 1 h, with DAF-FM (10 μM) and DNIC-2 (50 μM) for 4 h, and with DAF-FM (10 μM) and NONOate (133 μM) for 1 h, respectively. (e) Time-dependent change of fluorescence intensity of CCD-966SK cells treated with 10 μM of DAF-FM and 50 μM of DNIC-2 (black) or with 10 μM of DAF-FM and 133 μM of NONOate (red) for 0, 0.5, 1, 2, 4, and 8 h, which were fitted to pseudo-first-order kinetics. Data show the mean ± SD from three independent experiments. |

Low-dose DNIC-2 promotes the proliferation of human skin fibroblasts. (a) Representative live/dead staining images of DNIC-2-treated CCD-966SK cells and (b) their corresponding cell densities determined by counting the number of DAPI stained nuclei (n = 7). The data are presented as mean ± SD. **** p < 0.001. |
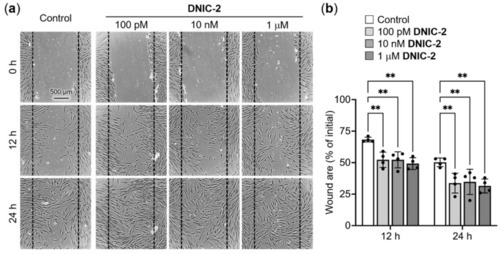
Low-dose DNIC-2 accelerates the migration of human skin fibroblasts. (a) Representative phase-contrast photomicrographs of DNIC-2-treated CCD-966SK cells in a scratch wound healing assay and (b) their corresponding wound area (n = 4). The data are presented as mean ± SD. ** p < 0.05. |
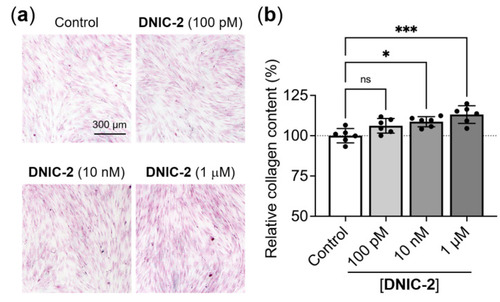
Low-dose DNIC-2 enhances the collagen deposition of human skin fibroblasts. (a) Representative Sirius red-stained CCD-966SK cells that received treatments of various concentrations of DNIC-2 and were incubated for seven days. (b) The corresponding collagen contents quantified by extracting the dye and measuring optical density at 540 nm (n = 6). The data are presented as mean ± SD. * p < 0.05; *** p < 0.005; ns, not significant. |
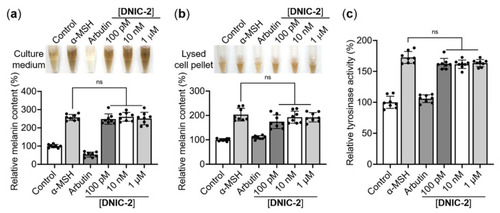
NO-delivery DNIC-2 does not promote pigmentation of B16-F10 melanoma cells. Representative photos and their corresponding melanin contents of (a) the culture media and (b) the NaOH-lysed cell pellets of B16-F10 melanoma cells exposed to α-MSH in the presence of DNIC-2 (n = 8). (c) Effects of DNIC-2 on cellular tyrosinase activity (n = 8). The data are presented as mean ± SD. ns, not significant. |

Cell viability assay of the (a) mouse skin melanoma (B16-F10) and (b) human skin keratinocyte cells (HaCaT) cells, respectively, treated with different concentrations of DNIC-2 for 24 h **** p < 0.001 compared to the group without treatment of DNIC-2. (c) Cell viability assay of the reconstructed human epidermis (RhE) model treated with PBS, 5% SDS, and 50 μM of DNIC-2, respectively. (d) Cell viability assay of the reconstructed human cornea-like epithelium model treated with DPBS, methyl acetate, and 50 μM of DNIC-2, respectively. |

Comparison of developmental toxicity of DNIC-2 and SNP in embryonic zebrafish. (a) Experimental design for ZET assay. (b) Viability of zebrafish embryos upon exposure to different concentrations of DNIC-2 (or SNP) for alternative durations. (c) Body length for DNIC-2- or SNP-treated zebrafish larvae at 96 hpf. (d) General morphology score for DNIC-2- or SNP-treated zebrafish larvae at 96 hpf. (e) Fraction of larvae with at least one teratogenic effect at 96 hpf. One-way ANOVA with Holm–Šidák test; ns, no significance. Data are expressed as mean + SD (N = 4, n = 7–12). |
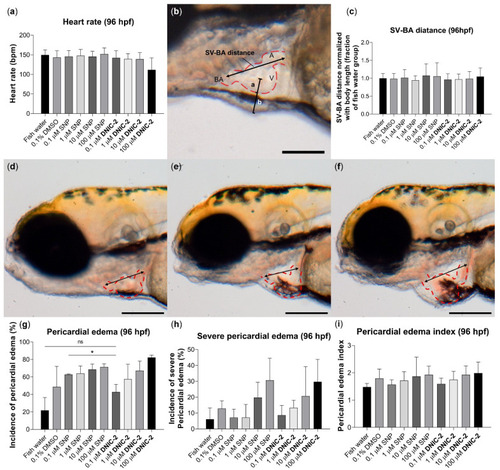
Treatment of DNIC-2 induced less severe pericardial edema than SNP in zebrafish embryos. (a) Heart rate for zebrafish embryos at 96 hpf in the control, DNIC-2-treated, and SNP-treated groups. (b) Graphical illustration of SV-BA distance and edema index. The measurement of SV-BA distance was indicated with a black arrow, whereas edema index was defined as the ratio of the semi-diameter of the pericardial cavity to that of the ventricle (b/a). Scale bar = 100 μm. (c) SV-BA distance normalized with body length. (d–f) Representative images of cardiac edema in different categories based on SV-BA measurement; the measurement points were indicated by arrows. The hearts were indicated by red dotted lines. Scale bar = 200 μm. (g) Fraction of larvae with cardiac edema at 96 hpf. (h) Incidence of severe cardiac edema at 96 hpf. (i) Pericardial edema index at 96 hpf. One-way ANOVA with Holm–Šidák test; * p < 0.05; ns, no significance. Data are expressed as mean + SD (N = 4, n = 7–12). |