
- Title
-
Myocardial protective effect and transcriptome profiling of Naoxintong on cardiomyopathy in zebrafish
- Authors
- Hu, M., Liu, P., Lu, S., Wang, Z., Lyu, Z., Liu, H., Sun, Y., Liu, F., Tian, J.
- Source
- Full text @ Chin. Med.
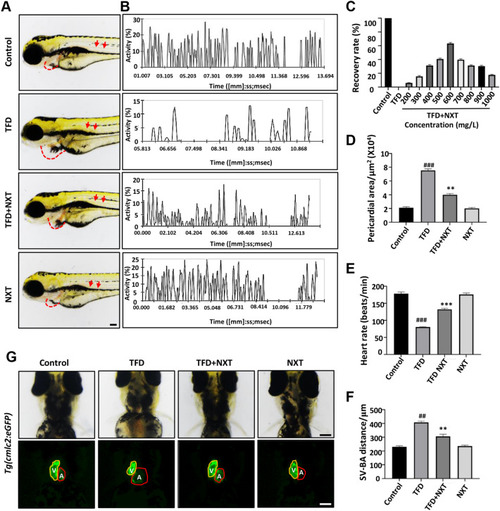
NXT treatment restored TFD-induced cardiomyopathy in zebrafish embryos. A Lateral view of four groups of zebrafish embryos at 4 dpf. TFD treated group showing pericardial edema (red dashed line) and slowed blood flow (red arrows). B Blood flow motion ratios of four groups of zebrafish embryos based on pixel density changes in RBCs. C Optimal recovery concentration of NXT. D Pericardial area of four groups of zebrafish larvae (n = 15 embryos/group). E Heart rates of four groups of zebrafish larvae (n = 15 embryos/group) F SV-BA distance of the four groups of zebrafish larvae (n = 15 embryos/group). G The heart morphology of four groups embryos at 96hpf delineated by Tg(cmlc2:GFP) (ventral view). Note the enlarged ventricles in the TFD treatment group (V ventricle; A atria). Data are represented mean ± standard deviation (SD) from three independent experiments, ##p < 0.01, ###p < 0.001 vs control group; **p < 0.01, ***p < 0.001 vs TFD-induced group (Student’s t test) |
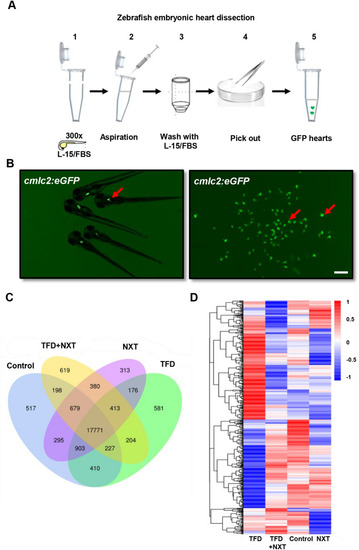
Transcriptome analysis of differentially expressed genes in NXT treated cardiomyopathy zebrafish hearts. A A schematic overview of heart isolation in zebrafish embryos. B The isolated cardiac tissues from Tg(cmlc2:eGFP) transgenic fish embryos at 96 hpf. C Venn diagram analysis and D Heat map representation showing DGEs in control, TFD, TFD + NXT and NXT group |
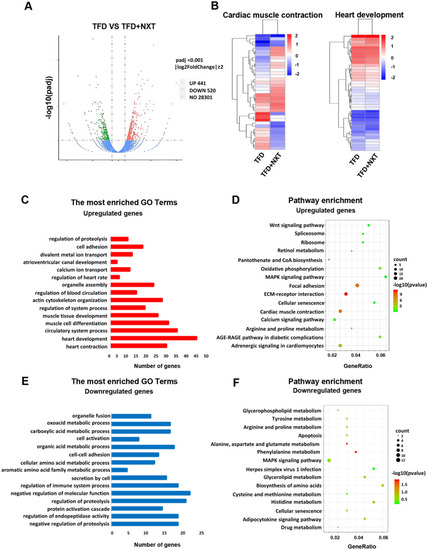
Bioinformatics analysis between TFD and TFD + NXT groups. A Volcano plots showing a total of 961 DGEs in TFD and TFD + NXT groups. B A heat-map showed that genes involved in cardiac muscle contraction and heart development. C GO term analysis and D KEGG pathway analysis for upregulate DEGs in TFD + NXT zebrafish embryo hearts compared to TFD group. E GO term analysis and F KEGG pathway analysis for upregulate DEGs in TFD + NXT zebrafish embryo hearts compared to TFD group. The size of the dot indicates the number of genes enriched in individual item. The color of the dot represents the p value |
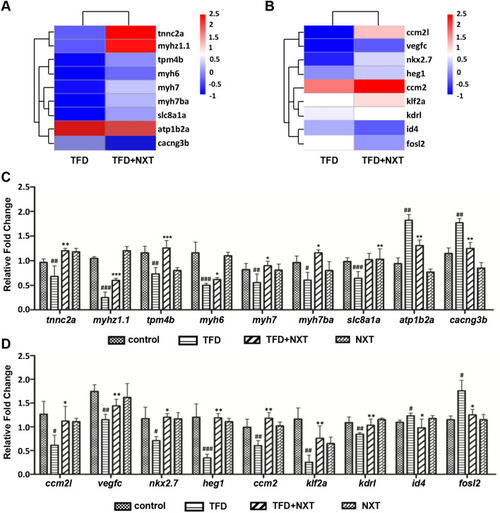
NXT targeting node screening and downstream pathways verification. A myocardium related genes and B cardiovascular development related genes explored by heat map analysis, and verified by qRT-PCR (C, D). Data are represented as mean ± SD. #p < 0.05, ##p < 0.01, ###p < 0.001 vs control group; *p < 0.05, **p < 0.01, ***p < 0.001 vs TFD-induced group |
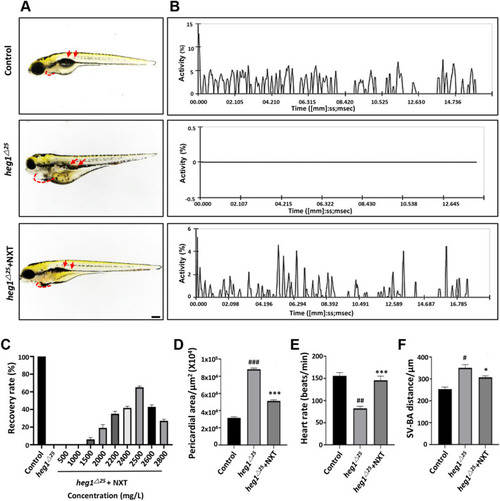
NXT restored cardiovascular malformation in heg1△25 mutant. A Lateral views of zebrafish embryos at 96 hpf. heg1△25 mutant embryos showing pericardial edema (red dashed line) and venous congestion (red arrows). B Blood flow motion ratios of three groups of zebrafish embryos based on RBCs pixel density changes. C Optimal recovery concentration of NXT. D Pericardial area of the three groups of zebrafish larvae (n = 15 embryos/group). E Heart rates of three groups of zebrafish larvae (n = 15 embryos/group). F SV-BA distance of three groups of zebrafish larvae (n = 15 embryos/group). #p < 0.05, ##p < 0.01, ###p < 0.001 vs control group; *p < 0.05, ***p < 0.001 vs heg1△25 mutant group |
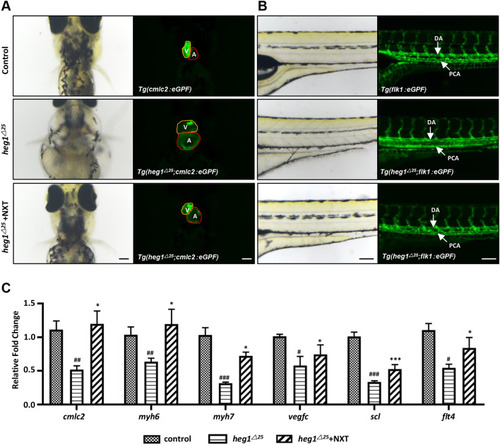
NXT ameliorated cardiovascular abnormalities in heg1△25 mutant. A Representative images of Tg(cmlc2:eGFP), Tg(heg1△25; cmlc2:eGFP) treated with or without NXT (ventral view). (V ventricle; A atria). B Representative images of Tg(fik1:eGFPi), Tg(heg1△25; fik1:eGFP) treated with or without NXT (lateral view). (DA dorsal aorta; PCV posterior main vein). C The expressions of cardiovascular markers, as determined by qRT-PCR, were significantly rescued by NXT treatment in heg1△25 mutant. Data are represented as mean ± SD. #p < 0.05, ##p < 0.01, ###p < 0.001 vs control group; *p < 0.05, ***p < 0.001 vs heg1△25 mutant group |
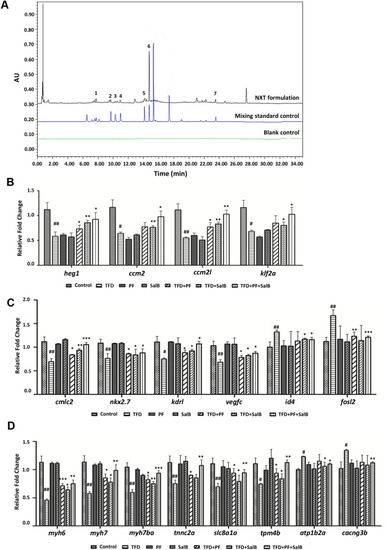
UPLC analysis of NXT combined with bioassays. A The fingerprints of the NXT. 1: HSYA, 2: PF, 3: FA, 4: CG, 5: RA, 6: Sal B, 7: Tan IIA. B HEG1-CCM signaling, C cardiovascular-related genes, D myocardial-related genes verified by qRT-PCR. Data are represented as mean ± SD. #p < 0.05, ##p < 0.01, ###p < 0.001 vs control group; *p < 0.05, **p < 0.01, ***p < 0.001 vs TFD-induced group |