
- Title
-
Fibroblast Growth Factor 21 Augments Autophagy and Reduces Apoptosis in Damaged Liver to Improve Tissue Regeneration in Zebrafish
- Authors
- Qiang, W., Shen, T., Noman, M., Guo, J., Jin, Z., Lin, D., Pan, J., Lu, H., Li, X., Gong, F.
- Source
- Full text @ Front Cell Dev Biol
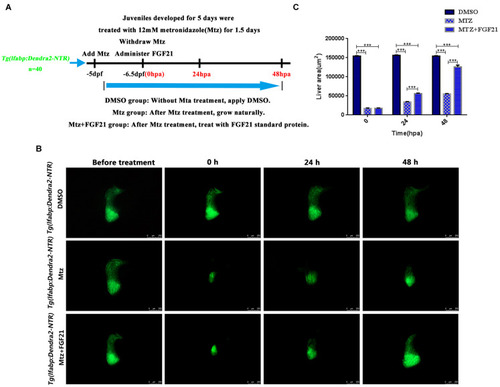
Fibroblast growth factor 21 improves liver regeneration after induced injury. After establishing the liver targeted-ablation model, FGF21 was administered and the treatment effect was evaluated. (A) The overall experimental process of FGF21 therapy for targeted liver ablation. (B) Liver regeneration at several time points after FGF21 treatment of the targeted ablated liver. (C) The histogram shows the quantification of the regenerated liver area assessed by ImageJ. DMSO group: without Mtz treatment, DMSO was applied. Mtz group: after Mtz treatment, the growth is natural Mtz+FGF21 group: after Mtz treatment, they were treated with FGF21 standard protein. Significance: ***p< 0.001 vs. DMSO group. Data are expressed as mean± standard error of mean (SEM) (n = 40 per group, repeat 3 times for each test). Scale bar = 250 μm. PHENOTYPE:
|
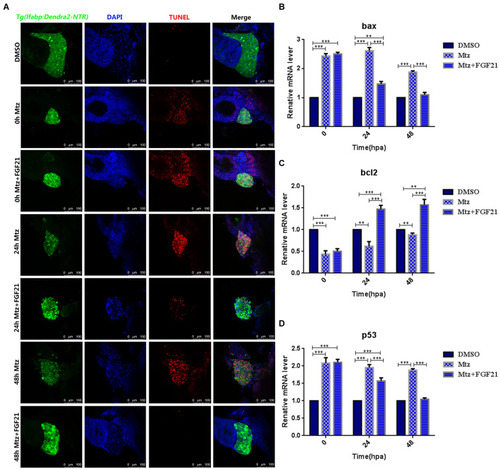
Fibroblast growth factor 21 inhibits liver cell apoptosis after injury. (A) TUNEL assay performed to assess the level of DNA damage in the damaged liver (nuclei, blue; damaged DNA, red; and liver cells, green). (B) RT-qPCR detection of bax mRNA of three groups at 0, 24, and 48 hpa. (C) RT-qPCR detection of bcl2 mRNA of three groups at 0, 24, and 48 hpa. (D) RT-qPCR detection of p53 mRNA of three groups at 0, 24, and 48 hpa. DMSO group: without Mtz treatment, DMSO was applied. Mtz group: after Mtz treatment, grow naturally. Mtz+FGF21 group: after Mtz treatment, treated with FGF21 standard protein. Significance: **p< 0.01, and ***p< 0.001 vs. DMSO group. Data are expressed as mean ± SEM (n = 40 per group, repeat 3 times for each test). Scale bar = 100 μm. |
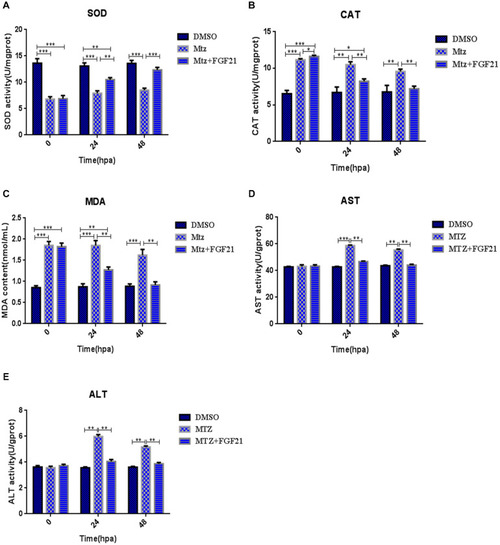
Fibroblast growth factor 21 reduces oxidative stress after liver injury. Samples were collected at 0, 24, and 48 hpa to assess oxidative stress in the damaged liver. (A) Evaluation of SOD activity in the control and differentially treated embryos. (B) Evaluation of CAT activity in the control and differentially treated embryos. (C) Evaluation of MDA content in the control and differentially treated embryos. (D) Evaluation of AST activity in the control and differentially treated embryos. (E) Evaluation of ALT activity in the control and differentially treated embryos. DMSO group: without Mtz treatment, DMSO was applied. Mtz group: after Mtz treatment, grow naturally. Mtz+FGF21 group: after Mtz treatment, treated with FGF21 standard protein. Significance: *p< 0.05, **p< 0.01, and ***p< 0.001 vs. DMSO group. Data are expressed as mean ± SEM (n = 40 per group, repeat 3 times for each test). PHENOTYPE:
|
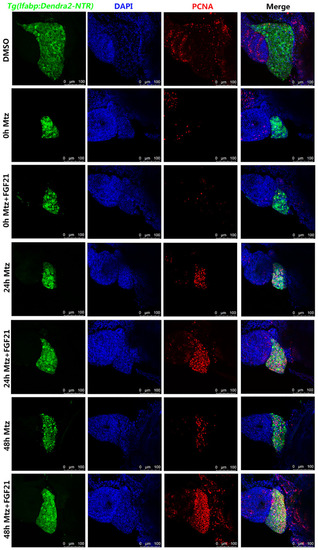
Fibroblast growth factor 21 accelerates liver cell regeneration after injury. Samples were collected at 0, 24, and 48 hpa to assess the production of new cells in the damaged liver. PCNA assay performed to assess the level of the formation of new cells in the damaged liver. Liver cells (green fluorescent Denra-NTR), stromal cells (blue fluorescent DAPI), and PCNA positive cells (red fluorescent). DMSO group: without Mtz treatment, DMSO was applied. Mtz group: after Mtz treatment, grow naturally. Mtz+FGF21 group: after Mtz treatment, treated with FGF21 standard protein (n = 40 per group, repeat 3 times for each test). Scale bar = 100 μm. PHENOTYPE:
|
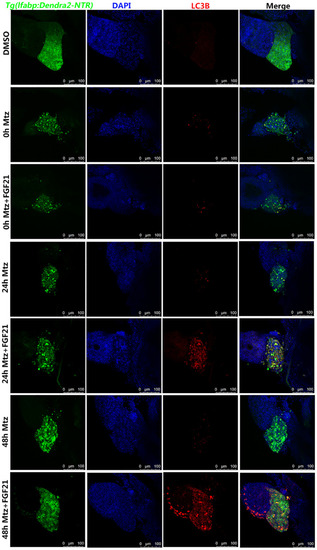
Fibroblast growth factor 21 promotes autophagy after liver injury. Samples were collected at 0, 24, and 48 hpa for the evaluation of autophagy. LC3B assay was performed to assess the level of autophagy in the damaged liver. Liver cells (green fluorescent Denra-NTR), stromal cells (blue fluorescent DAPI), and autophagy positive cells (red fluorescent LC3B). DMSO group: without Mtz treatment, DMSO was applied. Mtz group: after Mtz treatment, grow naturally. Mtz+FGF21 group: after Mtz treatment, treated with FGF21 standard protein (n = 40 per group, repeat 3 times for each test). Scale bar = 100 μm. |
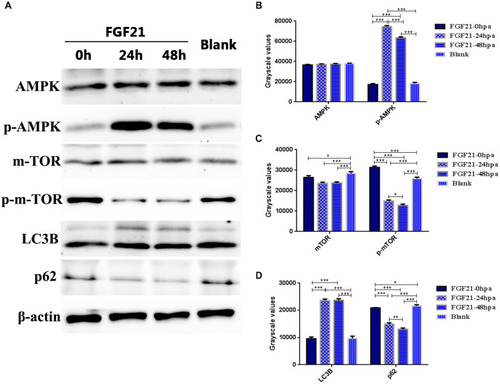
Fibroblast growth factor 21 up-regulates autophagy through AMPK-mTOR signaling pathway. Samples were collected from three groups at 0, 24, and 48 hpa. (A) Western blotting showing levels of AMPK, p-AMPK, mTOR, p-mTOR, LC3B, and P62, corrected for β-actin as internal control. (B) Quantification of immunohybridization signal of AMPK and p-AMPK by grayscale values. (C) Quantification of immunohybridization signal of mTOR and p-mTOR by grayscale values. (D) Quantification of immunohybridization signal of LC3B and P62 by grayscale values. DMSO group: without Mtz treatment, DMSO was applied. Mtz group: after Mtz treatment, grow naturally. Mtz+FGF21 group: after Mtz treatment, treated with FGF21 standard protein. Significance: *p < 0.05, **p< 0.01, and ***p< 0.001 vs. DMSO group. Data are expressed as mean ± SEM (n = 40 per group, repeat 3 times for each test). |