
- Title
-
An OpenCV-Based Approach for Automated Cardiac Rhythm Measurement in Zebrafish from Video Datasets
- Authors
- Farhan, A., Kurnia, K.A., Saputra, F., Chen, K.H., Huang, J.C., Roldan, M.J.M., Lai, Y.H., Hsiao, C.D.
- Source
- Full text @ Biomolecules

Schematic diagram showing the instrument setting and analysis pipeline for OpenCV-based cardiac rhythm detection in this study. A: atrium, V: ventricle. |
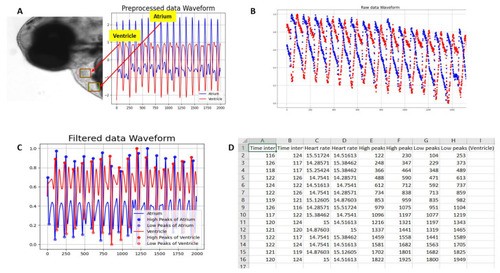
(A) ROI selection for ventricle and atrium in zebrafish heart video. The amplitude on the y-axis and the number of frames on the x-axis against the ROI in the selected video were presented. The division algorithm was to find the peaks based on each frequency of selected frames. (B) Raw heartbeat signals obtained from OpenCV. Blue peaks showing atrium heart rate, and red peaks presented ventricle heart rate. The X-axis contains the number of frames, and the y-axis shown amplitude based on pixels intensity. Overlay graph having atrium and ventricle beat per minute results. (C) The filtered heartbeat waveforms for both the atrium (blue color) and ventricle (red color). (D) Output data format in excel showing some important measurements. |

Comparison of heart rate and cardiac rhythm measurement in control zebrafish embryos aged at 72 hpf using either OpenCV or ImageJ methods. (A) Schematic diagram showing the basic definition for atrium and ventricle signals. (B) Comparison of heart rate obtained from either atrium (left panel) or ventricle (right panel) chambers using either ImageJ or OpenCV methods. (C) Comparison of the atrium to atrium (A-A) and ventricle to ventricle (V-V) intervals using either ImageJ or OpenCV methods. (D) Comparison of atrium-ventricle (A-V) and ventricle to atrium (V-A) intervals using either ImageJ or OpenCV methods. Comparison of atrium-atrium (A-A) (E) and ventricle-ventricle (V-V) (F) interval regularity using either ImageJ or OpenCV methods. Data was processed using unpaired t-test (B–D) as it follows the normal distribution. Pearson correlation (B) and Wilcoxon test (E,F) were conducted because the data does not obey normal distribution (*** p < 0.001, **** p < 0.0001). |
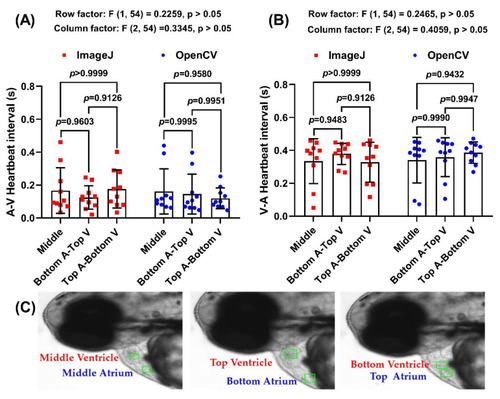
Comparison of Atrium-Ventricle (A) and Ventricle-Atrium (B) heartbeat interval using ImageJ and OpenCV method. (C) Schematic diagram showing the position for ROI selection. Data was processed using Two-Way ANOVA with Tukey comparison method and presented as Mean ± SEM; n = 10. |
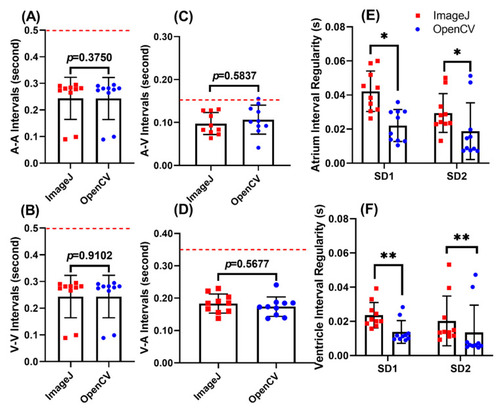
Comparison of heart rate regularity and cardiac rhythm measurement in IBMX treated zebrafish embryos aged at 72 hpf using either OpenCV (red color) or ImageJ (blue color) methods. Comparison of atrium to atrium (A-A) (A) and ventricle to ventricle (V-V) (B) intervals using either ImageJ or OpenCV methods. Comparison of atrium-ventricle (A-V) (C) and ventricle to atrium (V-A) (D) intervals using either ImageJ or OpenCV methods. Comparison of heartbeat regularity in either atrium (E) or ventricle (F) using either ImageJ or OpenCV methods, red dotted line signified the normal level of each parameter obtained from control group. Data was calculated using t-test (A,B) and Wilcoxon test (C–F), and presented as Mean ± SD, n = 10 (* p < 0.05; ** p < 0.01). |

Comparison of heart rate and cardiac rhythm measurement in 500 ppm Camphor-treated zebrafish embryos aged at 72 hpf using either OpenCV or ImageJ methods. Comparison of heart rate obtained from either atrium (A) or ventricle (B) chambers using ImageJ TSA and OpenCV methods. Comparison of atrium to atrium (A-A) (C) and ventricle to ventricle (V-V) (D) intervals using ImageJ and OpenCV methods. Comparison of heartbeat regularity in either atrium (E) or ventricle (F) using either ImageJ or OpenCV methods, red dotted line signified normal value of each parameter obtained from control group. Data was calculated using t-test (A,B) and Wilcoxon test (C–F), and presented as Mean ± SD, n = 10 (* p < 0.05; ** p < 0.01). |
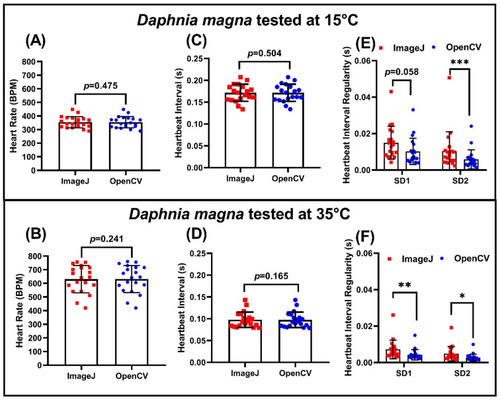
OpenCV can be used to detect an ultrafast heartbeat in Daphnia magna. Comparison of heart rate obtained from at either 15 °C (A) or 35 °C (B) using ImageJ TSA and OpenCV methods. Comparison of heartbeat intervals at either 15 °C (C) or 35 °C (D) using ImageJ and OpenCV methods. Comparison of heartbeat regularity at either 15 °C (E) or 35 °C (F) using ImageJ TSA and OpenCV methods. Data was calculated using Wilcoxon test and presented as Mean ± SD, n = 20 (* p < 0.05; ** p < 0.01; *** p < 0.001). |

OpenCV can be used to detect heartbeat irregularity in Daphnia magna. Comparison of heart rate (A) and heartbeat interval (B) obtained using ImageJ TSA and OpenCV methods. Comparison of heartbeat regularity using ImageJ and OpenCV methods (C), red dotted line signifies normal value of each parameter obtained from control group. Poincare plots were used to measure heartbeat regularity for either ImageJ (D) or OpenCV (E) methods. Data was calculated using Wilcoxon test and presented as Mean ± SD, n = 14 (** p < 0.01; *** p < 0.001). |