
- Title
-
Mechanical overstimulation causes acute injury and synapse loss followed by fast recovery in lateral-line neuromasts of larval zebrafish
- Authors
- Holmgren, M., Ravicz, M.E., Hancock, K.E., Strelkova, O., Kallogjeri, D., Indzhykulian, A.A., Warchol, M.E., Sheets, L.
- Source
- Full text @ Elife

( PHENOTYPE:
|
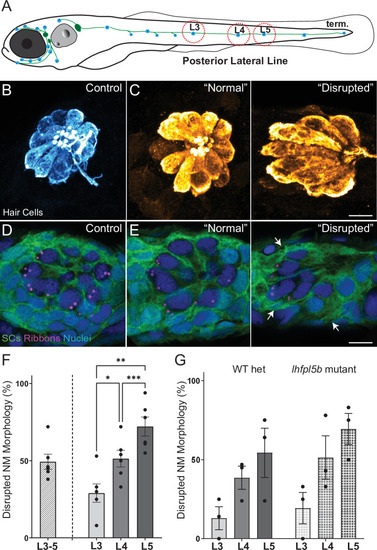
(A) Schematic of a larval zebrafish. Blue dots indicate neuromasts of the lateral-line organs; green lines indicate innervating afferent lateral-line nerves. pLL neuromasts L3, L4, and L5 were analyzed (dashed circles). (B–C) Maximum intensity dorsal top-down 2D projections of confocal images of control or stimulus-exposed neuromast hair cells (blue (B) or orange (C); Parvalbumin immunolabel). Exposed neuromast hair-cell morphology was categorized as ‘normal’ i.e. radial hair-cell organization indistinguishable from control or ‘disrupted’ i.e. asymmetric organization with the hair-cell apical ends oriented posteriorly. (D) Maximum intensity projections of supporting cells (SCs) expressing GFP (green), immunolabeled synaptic ribbons (magenta; Ribeye b) and all cell nuclei (blue; DAPI). Note that SCs underlying displaced hair cells also appear physically disrupted (indicated by white arrows). Scale bars: 5 µm (F) Average percentage of neuromasts with ‘disrupted’ morphology following mechanical stimulation. Each dot represents the percentage of disrupted neuromasts (NM) in a single experimental trial. Disrupted hair-cell morphology was place dependent, with neuromasts more frequently disrupted following sustained stimulus and when localized toward the posterior end of the tail (*p = 0.0386, **p = 0.0049, ***p = 0.0004) (G) Average percentage of exposed neuromasts (NM) with ‘disrupted’ morphology in lhfpl5b mutants, which lack mechanotransduction specifically in lateral-line hair cells, vs. heterozygous WT. lhfpl5b mutants show a similar gradient of neuromast disruption following mechanical injury as WT siblings. Error Bars = SEM.
|
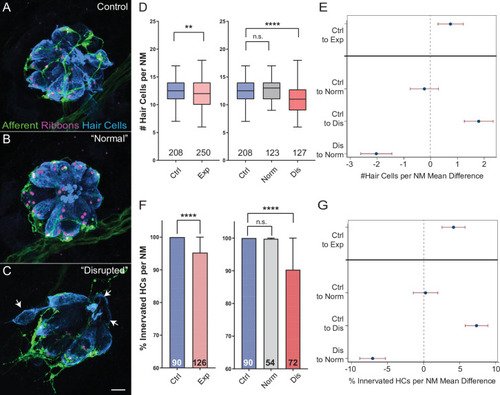
(A–C) Representative maximum intensity projection images of control (A) or exposed lateral line neuromasts with ‘normal’ (B) or ‘disrupted’ (C) morphology immediately following sustained strong wave exposure (0 hr). Synaptic ribbons (magenta; Ribeye b) and hair cells (blue; Parvalbumin) were immunolabled. Afferent neurons were expressing GFP. Scale bar: 5 µm (D) Hair-cell number per neuromast immediately post exposure. A significant reduction in hair-cell number was observed (**Adj p = 0.0019) and was specific to ‘disrupted’ neuromasts (Adj p = 0.3859 normal, ****Adj p < 0.0001 disrupted). Pink box plot (Exp) represents pooled exposed neuromasts, while gray (Norm) and red (Dis) plots represent neuromasts parsed into normal and disrupted groups. Numbers beneath each plot indicate the number of neuromasts per group. Whiskers = min to max (E) Differences of least squares means in hair-cell number per neuromast between groups. Bars represent 95 % confidence interval (CI). (F) Percentage of neuromast hair cells innervated by afferent nerves. Numbers within each bar indicate the number of neuromasts per group. A significant portion of neuromast hair cells lacked afferent innervation following exposure (****Adj p < 0.0001). Hair cells lacking afferent innervation were specifically observed in disrupted neuromasts (Adj p = 0.7503 normal, ****Adj p < 0.0001 disrupted). (G) Differences of least squares means in % hair cells innervated per neuromast between groups. Bars represent 95% CI.
|
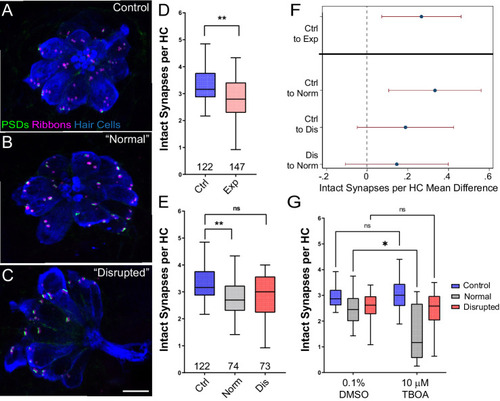
(A–C) Representative maximum intensity projection images of unexposed (A), or stimulus exposed lateral-line neuromast with ‘normal’ (B) or ‘disrupted’ (C) morphology. Synaptic ribbons (magenta; Ribeye b), PSDs (green; MAGUK) and hair cells (blue; Parvalbumin) were immunolabled. Scale bar: 5 µm (D–E) Intact synapses per neuromast hair cell. Pink box plot in D (Exp) represents pooled exposed neuromasts while, in E, gray (Norm) and red (Dis) plots represent neuromasts parsed into normal and disrupted groups. Whiskers = min to max. The average number of intact synapses per hair cell was significantly reduced in exposed neuromasts (D; **Adj p = 0.0078); when parsed, this reduction was significant in the ‘normal’ exposure group relative to control (E; **Adj p = 0.0043 normal, Adj p = 0.1207 disrupted). (F) Differences of least squares means in number of intact synapses per hair cell between groups. Bars represent 95% CI. (G) The number of intact synapses per hair cell in larvae co-treated with TBOA, to block glutamate clearance, or drug carrier alone during exposure. Synapse loss was significantly greater in ‘normal’ neuromasts co-exposed to TBOA compared to fish co-exposed to the drug carrier alone (Two-way ANOVA. *p < 0.0187).
|
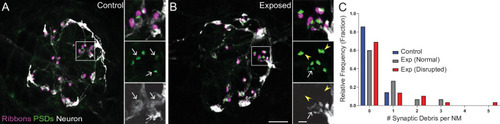
(A–B) Representative images of control (A) and exposed (B) neuromasts. Synaptic ribbons (magenta; Ribeye b) and PSDs (green; MAGUK) were immunolabeled; hair cells were also immunolabeled, but not shown for clarity. Afferent neurons (white) were labeled with GFP. Insets: Arrows indicate intact synapses adjacent to afferent neurons; arrowheads (B) indicate synaptic debris. Scale bars: 5 µm (main panels), 1 µm (insets). (C) Frequency histogram of observed synaptic debris per neuromast (NM). While control neuromasts occasionally had one detached synapse, exposed neuromasts were observed that had up to five detached synapses.
|
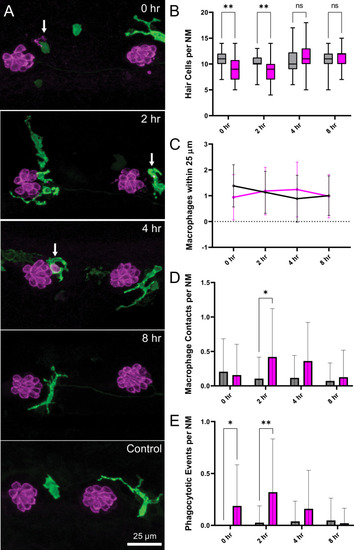
Experiments used Tg(mpeg1:yfp) fish that express YFP under regulation of the macrophage-specific mpeg1 promoter. All images and data were collected from the two distal-most neuromasts of the posterior lateral line (Figure 2A; term). (A) Macrophages (green) responded to mechanical injury by entering neuromasts, contacting hair cells and internalizing Otoferlin-immunolabeled debris (arrows, magenta). Images show examples of macrophage behavior at different time points after noise trauma. (B) Quantification of hair-cell number in the terminal neuromasts. Hair-cell number was significantly reduced at 0–2 hr after noise exposure (Mixed-effects analysis: **p < 0.003). (C) Quantification of macrophages within a 25 µm radius of the neuromasts at 0–8 hr after noise injury. Most neuromasts possessed 1–2 nearby macrophages and this number was not changed by noise exposure. (D) Quantification of direct contacts between macrophages and hair cells. The number of macrophage-hair cell contacts was counted at each survival time after noise exposure and normalized to the total number of sampled neuromasts. Increased levels of contact were observed at 2 and 4 hr after noise (*p = 0.0243). (E) Quantification of phagocytosis as a function of post-noise survival time. The numbers of macrophages that had internalized otoferlin-labeled material were counted at each time point and normalized to the total number of sampled neuromasts. The percentage of macrophages that contained such debris was significantly increased at 0–2 hr after strong water wave stimulus (*p = 0.0465; **p = 0.0013). Data were obtained from 26 to 50 neuromasts/time point. Error Bars = SD.
|
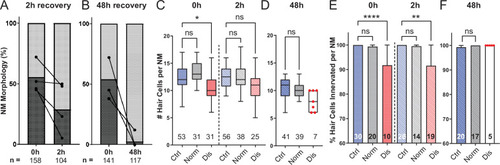
(A,B) Average percentage of exposed neuromasts with ‘normal’ vs. ‘disrupted’ morphology following exposure. Each dot represents the percentage of disrupted neuromasts (L3–L5) in a single experimental trial; lines connect data points from the same cohort of exposed fish following 2 hr (A) or 48 hr (B) recovery. (C,D) Multilevel analysis of hair-cell number per neuromast immediately (0 hr) post-exposure or after 2 or 48 hr recovery. Numbers beneath each plot indicate the number of neuromasts per group. Whiskers = min to max. Morphologically ‘disrupted’ neuromasts have significantly fewer hair cells at 0 hr but not 2 hr following exposure C; *Adj p = 0.0321 (0h disrupted), Adj p = 0.1875 (2h disrupted). Most exposed neuromasts were morphologically ‘normal’ following 48 hr recovery and had a comparable number of hair cells relative to control (D; Adj p = 0.4443). (E,F) The percentage of ‘disrupted’ neuromast hair cells lacking afferent innervation was significant following 0 hr and 2 hr recovery (E; ****Adj p < 0.0001 (0h disrupted), **Adj p = 0.0016 (2h disrupted)). All hair cells were fully innervated following 48 hr recovery, including the few neuromasts with ‘disrupted’ morphology (F; aligned red dots).
|
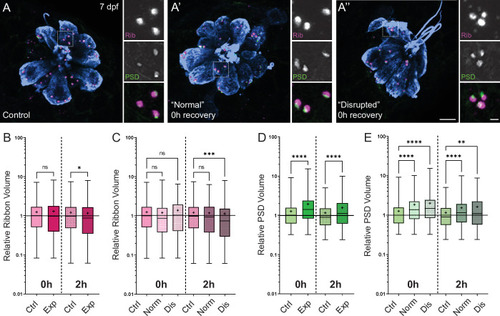
(A-A’’) Representative images of control (A) and exposed (A’, A”) neuromasts. Synaptic ribbons (magenta; Ribeye b), PSDs (green; MAGUK), and hair cells (blue, Parvalbumin) were immunolabeled. Scale bars: 5 µm (main panels), 1 µm (insets). (B–E) Box and whisker plots of relative synapse volumes normalized to 0 hr control. Whiskers indicate the min. and max. values; ‘+’ indicates the mean value, horizontal lines indicate the relative median value of the control. (B) Ribbon volume appeared comparable to control immediately following exposure but was reduced 2 hr after exposure (*p = 0.0195). (C) Significant reduction in ribbon size relative to control was specific to disrupted neuromasts (Kruskal-Wallis test: ***p = 0.0004 (2h)). (D) Significantly larger PSDs were observed both immediately and 2 hr following exposure (****p < 0.0001). (E) Enlarged PSDs were present in both ‘normal’ and ‘disrupted’ exposed neuromasts, with a greater enlargement observed 0 hr post-exposure (Kruskal-Wallis test: ****p < 0.0001 (0h); ***p = 0.0001, **p = 0.0024 (2h)).
|

(A–E) Representative images of tail neuromasts of control fish larvae. Each hair cell carries a kinocilium, which is visibly thicker than its neighboring actin-filled, mechanosensitive stereocilia: see panel C featuring both structures at higher magnification (the kinocilium diameter is 220 nm, while stereocilia measured 90–110 nm). The kinocilia of control neuromasts are long (10–15 µm) and bundled together, while the stereocilia bundles have an apparent staircase arrangement. (F–K) Representative images of damaged tail neuromasts immediately following noise exposure featuring short (F-H, yellow arrows), disorganized (G, H), and swollen (I-K, yellow arrowheads) kinocilia, and disorganized stereocilia. (K) Same stereocilia bundle as in J marked with an asterisk at higher magnification to highlight the difference in the diameter of the kinocilium (360 nm) and neighboring stereocilia (85–100 nm) for noise exposed hair cells, as compared to the control hair cells in C. Scale bars: A, B, D-J – 2 µm; C, K – 500 nm. (L–M) Kinocilia diameter at bundle level (L; Mann Whitney test ***p = 0.0007) and 3–5 µm above bundle level (M; Welch’s t test *p = 0.0243). Exposed NM data in L were not normally distributed (D'Agostino-Pearson test ****p < 0.0001). Error Bars = SD.
|
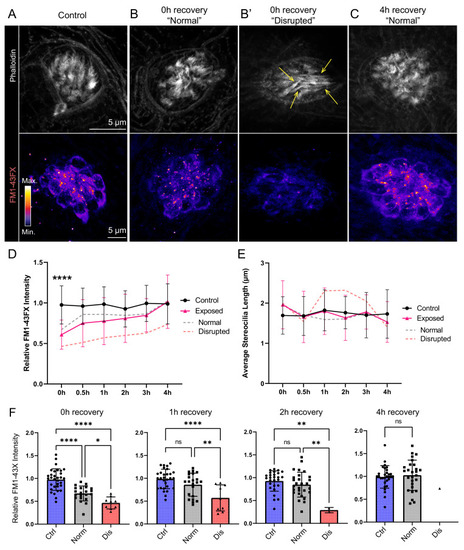
(A–C) Representative images of hair-cell stereocilia (conjugated phalloidin, gray) and FM1-43FX fluorescence intensity of the corresponding neuromast in representative control (A) or mechanically overstimulated fish immediately (B, B’) or 4 hr (C) following exposure. Yellow arrows in (B’) indicate phalloidin labeling that appeared tapered. (D) Average relative FM1-43FX fluorescence intensity measurements in control and exposed neuromasts over 4 hr of recovery. FM1-43FX uptake was significantly reduced in exposed neuromasts immediately following mechanical overstimulation but appear to completely recover by 4 hr (Tukey’s multiple comparisons test ****p < 0.0001 (0h), p = 0.0579 (1 h), p = 0.8387 (2h), p = 0.8387 (4h)). Dashed lines indicate FM1-43FX fluorescence intensity measurements in exposed neuromasts parsed into ‘normal’ and ‘disrupted’ morphologies. (E) Average stereocilia length of centrally localized hair bundles in control and exposed neuromasts. Dashed lines indicate measurements in exposed neuromasts parsed into ‘normal’ and ‘disrupted’ morphologies. Error Bars = SD (F) Relative FM1-43FX fluorescence in both ‘normal’ and ‘disrupted’ exposed neuromasts was significantly reduced immediately following exposure but recovered over time (Tukey’s multiple comparisons test ****p < 0.0001, *p = 0.0328 (0h); ****p < 0.0001, **p = 0.0098 (1h); **p = 0.0025 control vs. dis, **p = 0.0089 normal vs. dis (2 h)). Each point represents an individual neuromast. Nearly all observed exposed neuromasts appeared morphologically normal following 4 hr; note only one neuromast data point in the disrupted category of the 4 hr recovery graph. Data were obtained from 26 to 32 neuromasts per condition over three trials.
|

(A,B) Representative cross-section images of EdU (magenta) labeling of proliferating neuromast cells. Fish were exposed to EdU for 4 hr following stimulus exposure. Supporting cells (SC) were expressing GFP. Scale bars: 5 µm (C) Average number of EdU + cells per neuromast were comparable in control and exposed larvae. Data were obtained from 33 to 34 neuromasts per condition over three trials (Two-way ANOVA. p = 0.4193). Bars represent 95% CI.
|