
|
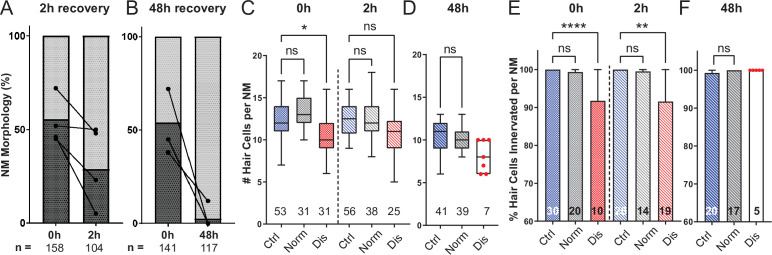
Figure 7
(A,B) Average percentage of exposed neuromasts with ‘normal’ vs. ‘disrupted’ morphology following exposure. Each dot represents the percentage of disrupted neuromasts (L3–L5) in a single experimental trial; lines connect data points from the same cohort of exposed fish following 2 hr (A) or 48 hr (B) recovery. (C,D) Multilevel analysis of hair-cell number per neuromast immediately (0 hr) post-exposure or after 2 or 48 hr recovery. Numbers beneath each plot indicate the number of neuromasts per group. Whiskers = min to max. Morphologically ‘disrupted’ neuromasts have significantly fewer hair cells at 0 hr but not 2 hr following exposure C; *Adj p = 0.0321 (0h disrupted), Adj p = 0.1875 (2h disrupted). Most exposed neuromasts were morphologically ‘normal’ following 48 hr recovery and had a comparable number of hair cells relative to control (D; Adj p = 0.4443). (E,F) The percentage of ‘disrupted’ neuromast hair cells lacking afferent innervation was significant following 0 hr and 2 hr recovery (E; ****Adj p < 0.0001 (0h disrupted), **Adj p = 0.0016 (2h disrupted)). All hair cells were fully innervated following 48 hr recovery, including the few neuromasts with ‘disrupted’ morphology (F; aligned red dots).
Mechanically overstimulated neuromasts recover hair-cell morphology, hair-cell number, and innervation.