FIGURE SUMMARY
Title

SOCS3 is Related to Cell Proliferation in Neuronal Tissue: An Integrated Analysis of Bioinformatics and Experiments

Authors
Yu, Y., Sung, S.K., Lee, C.H., Ha, M., Kang, J., Kwon, E.J., Kang, J.W., Kim, Y., Kim, G.H., Heo, H.J., Lee, H., Kim, T.W., Lee, Y., Myung, K., Oh, C.K., Kim, Y.H.
Source
Full text @ Front Genet

FIGURE 1. Workflow of gene expression analysis of RNA-seq datasets TCGA and CGGA. Each datasets were run through the pipeline individually, then selected common DEGs between GBM and LGG.

EXPRESSION / LABELING:
Gene:
Fish:
Knockdown Reagent:
Anatomical Terms:
Stage: Long-pec
PHENOTYPE:
Fish:
Knockdown Reagent:
Observed In:
Stage: Long-pec

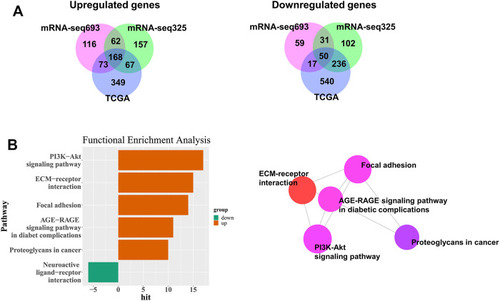
Identification of DEGs among TCGA and CGGA datasets of GBM and LGG. (A) Venn diagrams of overlapping DEGs among TCGA, CGGA mRNA-seq325 and CGG mRNA-seq693. (B) Significantly enriched biological process and network.

Univariate survival analysis in GBM and LGG stratified by SOCS3 expression based on the TCGA and CGGA data. (A) Among common DEGs, SOCS3 was identified as the significant gene by univariate Cox regression. Kaplan-Meier estimates of glioma patient survival according to SOCS3 gene expression from (B) TCGA, (C) CGGA325, (D) and CGGA693. (E) Comparison of SOCS3 gene expression between the GBM and LGG cohorts from TCGA, CGGA325 and CGGA693.

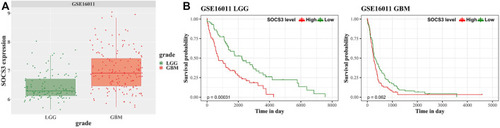
Univariate survival analysis in GBM and LGG stratified by SOCS3 expression based on the GSE16011 dataset for validation. (A) Comparison of SOCS3 gene expression between the GBM and LGG cohorts from GSE16011. (B) Kaplan-Meier estimates of glioma patient survival according to SOCS3 gene expression.

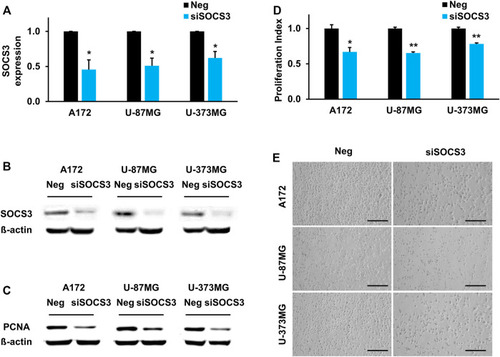
SOCS3 governs brain development by regulating proliferation capacity. (A,B) Downregulated SOCS3 expression levels upon transfecting siSOCS3 in human GBM cell lines. (C) Comparison of PCNA expression after siSOCS3 transfection by western blot analysis. (D) Measurement of cell proliferation rate and corresponding images. Scale bars, 100 µm.

The zebrafish analogue socs3b governs brain development by regulating proliferation. (A) Representative images of A172 cells were obtained using a microscope fitted with a digital camera (scale bars, 300 µm). Different concentrations of DHE were added to the culture media of the glioblastoma A172 cells, and cell viability was measured using the MTT assay. (B) Dorsal view of live images with uninjected control embryos, socs3b-MO-injected embryos, and socs3b-MO- and socs3b-mRNA-co-injected embryos (left panel, red dotted lines indicate brain area), and quantified data of the brain area using ImageJ (right panel). (C) Dorsal view of confocal images after EdU staining with uninjected embryos and socs3b-MO-injected embryos (left panel, red dotted lines indicate brain area), and quantified intensity of EdU signals (right panel). (D) Dorsal view of WISH images using the cell proliferation marker pcna in uninjected embryos and socs3b-MO-injected embryos. Scale bars indicate 200 µm in each image (***p < 0.0001, *p < 0.05).

Acknowledgments
This image is the copyrighted work of the attributed author or publisher, and ZFIN has permission only to display this image to its users. Additional permissions should be obtained from the applicable author or publisher of the image. Full text @ Front Genet