
Image
|
Figure Caption
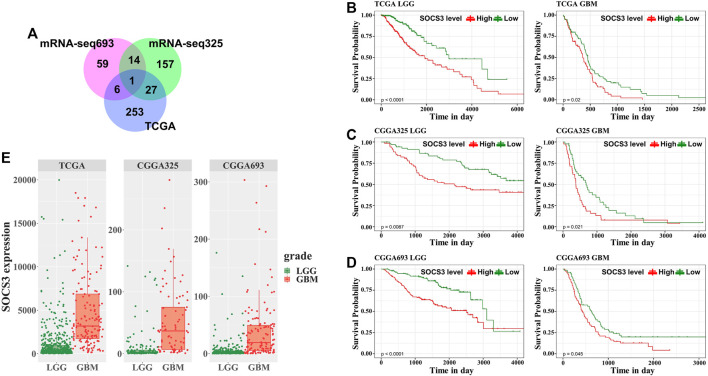
FIGURE 3
Univariate survival analysis in GBM and LGG stratified by SOCS3 expression based on the TCGA and CGGA data.
Acknowledgments
This image is the copyrighted work of the attributed author or publisher, and
ZFIN has permission only to display this image to its users.
Additional permissions should be obtained from the applicable author or publisher of the image.
Full text @ Front Genet