
- Title
-
New insights into benzo[⍺]pyrene osteotoxicity in zebrafish
- Authors
- Tarasco, M., Gavaia, P.J., Bensimon-Brito, A., Cardeira-da-Silva, J., Ramkumar, S., Cordelières, F.P., Günther, S., Bebianno, M.J., Stainier, D.Y.R., Cancela, M.L., Laizé, V.
- Source
- Full text @ Ecotoxicol. Environ. Saf.
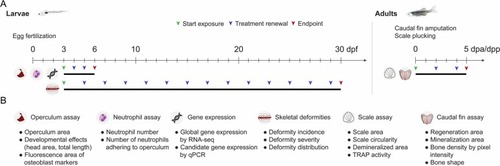
Fig. 1. Experimental design of the zebrafish assays used to assess the effects of BaP exposure on bone throughout development and regeneration. (A) Time course of the in vivo assays performed using larval (left panel) and adult stages (right panel), including information on the onset of BaP exposure, the schedule for treatment renewals and endpoint collection. dpf, days post-fertilization; dpa, days post-amputation; dpp, days post-plucking. (B) Biological parameters evaluated at each endpoint for each assay. For interpretation of the references to color in this figure legend, the reader is referred to the web version of this article. |
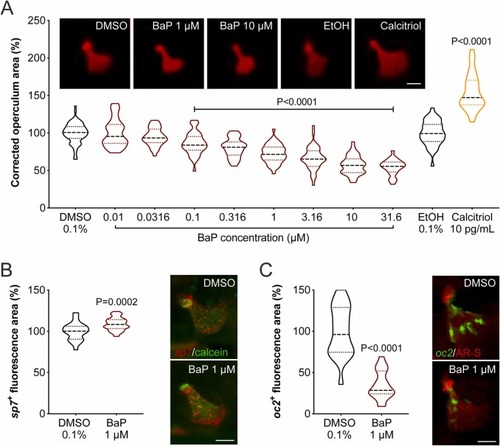
Fig. 2. (A) Operculum growth in zebrafish larvae exposed to increasing concentrations of BaP from 3 to 6 dpf. Regions of interest (operculum and head area) were determined through the morphometric analysis of AR-S stained bone structures imaged by fluorescence microscopy. Representative images of AR-S stained operculum are presented on the top of the graph (background was removed using image processing software to highlight operculum structure). Dimethyl sulfoxide (DMSO) and ethanol (EtOH) were used as vehicle for BaP and calcitriol, respectively. Scale bar is 50 µm. P-value calculated using one-way ANOVA followed by Dunnett's multiple comparison test for BaP/DMSO and Student's t-test for calcitriol/EtOH. Values are presented as median and quartiles (n ≥ 25). (B, C) Expression of osteoblast marker genes in the operculum of zebrafish larvae exposed to 1 μM BaP or 0.1% DMSO from 3 to 6 dpf. (B) osterix (sp7), a marker of immature osteoblasts, appears in red in the Tg(Ola.Sp7:mCherry-Eco.NfsB)pd46 line; operculum is counter-stained with calcein. (C) osteocalcin (oc2), a marker of mature osteoblasts, appears in green in the Tg(Ola.osteocalcin:EGFP)hu4008 line; operculum is counter-stained with AR-S. Representative images of the operculum are presented on the right side of the respective graph. Scale bar is 50 µm. P-value calculated using Student's t-test. Values are presented as median and quartiles (n ≥ 21). For interpretation of the references to color in this figure legend, the reader is referred to the web version of this article. |
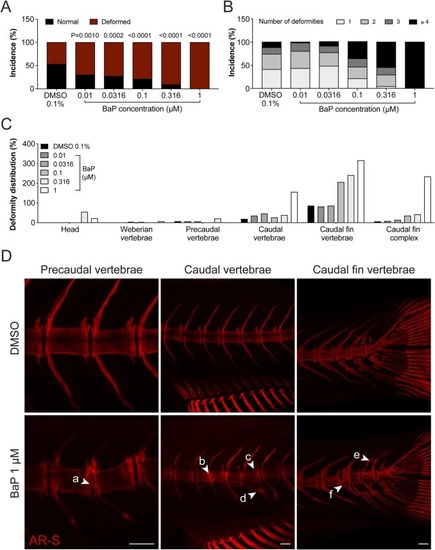
Fig. 3. Deformities in the axial skeleton of 30 dpf juvenile zebrafish exposed to increasing concentration of BaP throughout their development. (A) Percentage of normal and deformed zebrafish. (B) Percentage of deformities per deformed larvae. (C) Distribution of the deformities along the axial skeleton. Deformed structures of each individual were summed and divided by the number of fish. (D) Representative fluorescence images of AR-S stained skeletal structures exposed to 0.1% DMSO or 1 μM BaP. Arrowheads point to: a, partially fused vertebrae; b, fused vertebrae; c, deformed vertebrae; d, fused hemal arches; e, ectopic mineralization; f, platyspondyly. Scale bar is 100 µm. P-value calculated using chi-squared test, 1 degree of freedom. n ≥ 65, except for BaP 1 μM (n = 18). For interpretation of the references to color in this figure legend, the reader is referred to the web version of this article. |
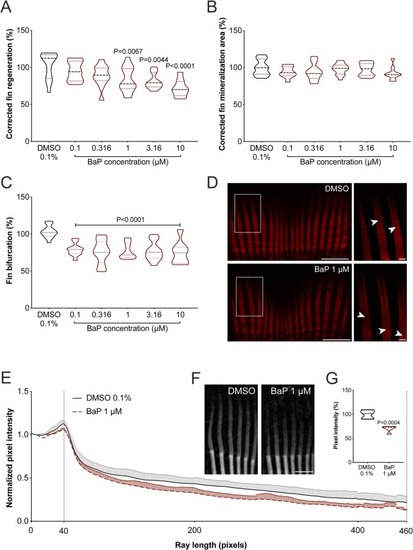
Fig. 4. Regeneration of the caudal fin in adult zebrafish exposed to increasing concentrations of BaP for 5 days after finectomy. (A) Caudal fin tissue regeneration, (B) de novo bone formation and (C) ray bifurcation was assessed through morphometric analysis of the fin structures in bright-field and fluorescence images. Fin bifurcation corresponds to the ratio between the distance from the stump to the bifurcation point / distance from stump to ray tip (D) Representative images of the regenerating caudal fin rays exposed to 0.1% DMSO or 1 μM BaP. Magnification of the boxed area is presented in the right panel. Arrowheads point to ray bifurcation point. Scale bar is 1 mm in left panels and 0.1 mm in right panels. P-value calculated using one-way ANOVA followed by Dunnett's multiple comparison test. Values are presented as median and quartiles (n ≥ 9). (E-G) Density of regenerating caudal fin rays from adult zebrafish exposed to BaP for 5 days after finectomy assessed through ray pixel intensity micro–computed tomography (µCT) images. (E) Averaged normalized pixel intensity along regenerated rays from 40 (amputation plane) to 460 pixels. (F) Representative µCT images of the regenerating caudal fin rays exposed to 0.1% DMSO or 1 μM BaP. Scale bar is 1 mm. (G) Area under curve (40–460 pixels). P-value calculated using Student's t-test. Values are presented as median and quartiles (n = 5). For interpretation of the references to color in this figure legend, the reader is referred to the web version of this article. |
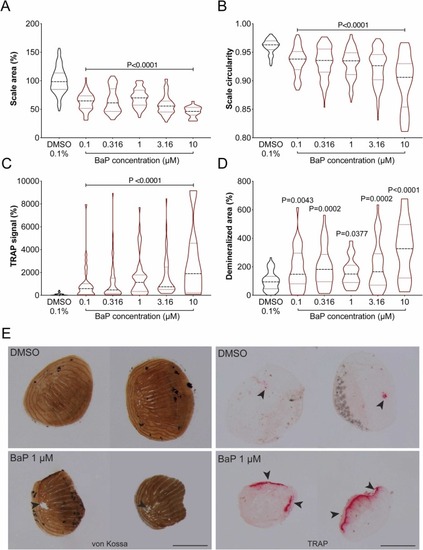
Fig. 5. Morphology, mineral content and osteoclast activity of regenerating scales from adult zebrafish exposed to increasing concentration of BaP for 5 days after plucking. (A) Scale area and (B) circularity were assessed through morphometric analysis of regenerating scales in bright-field images. (C) Osteoclast activity was assessed through TRAP (Tartrate-Resistant Acid Phosphatase) staining while (D) mineral content was evaluated through von Kossa staining. (E) Representative images of von Kossa (left panels) and TRAP (right panels) stained scales collected from adults exposed to either 0.1% DMSO or 1 μM BaP. Arrowheads point to demineralized areas or regions of TRAP signal. Scale bar is 0.5 mm. P-value calculated using Kruskal-Wallis test followed by Dunn's multiple comparisons test for TRAP activity and one-way ANOVA followed by Dunnett's multiple comparison test for scale area, scale circularity and demineralized area. Values are presented as median and quartiles (n ≥ 20; n = 9 at BaP 10 μM in Demineralized area). For interpretation of the references to color in this figure legend, the reader is referred to the web version of this article. |
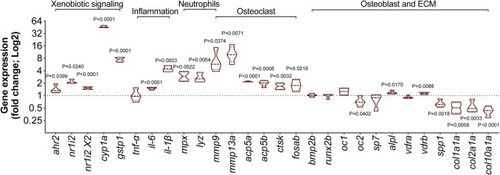
Fig. 6. Gene expression levels in zebrafish larvae exposed to 1 μM BaP from 3 to 6 dpf. The averaged expression of eef1a1l1 and rps18 housekeeping genes was used to normalize gene expression levels. P-value calculated using Student's t-test. Values are presented as median and quartiles expressed in Log2 over the control (0.1% DMSO) (n = 4). |
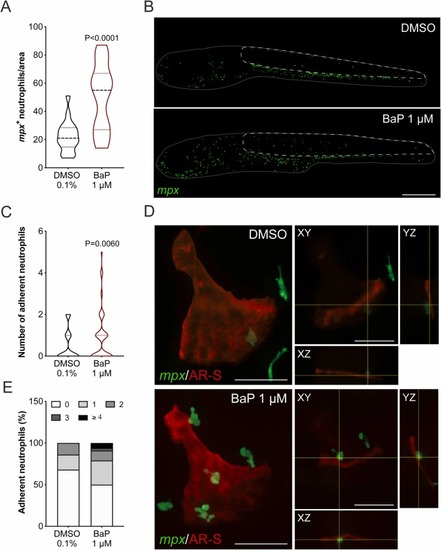
Fig. 7. Number of neutrophils in TgBAC(mpx:EGFP)i114 zebrafish larvae exposed to BaP from 3 to 6 dpf. (A) Number of neutrophils in the region of interest (ROI) expressed in % over control. (B) Representative images of transgenic larvae exposed to 0.1% DMSO or 1 μM BaP, where TgBAC(mpx:EGFP)i114 positive cells are in green. ROI is outlined with a white dashed line, while larvae is outlined with a gray line. Scale bar is 500 µm. P-value calculated using Student's t-test. Values are presented as median and quartiles (n = 18). (C) Number of adherent neutrophils on the opercular bone stained with AR-S. P-value calculated using Mann Whitney test. Values are presented as median and quartiles (n = 109). (D) Representative images of adherent neutrophils on the operculum of larvae exposed to 0.1% DMSO or 1 μM BaP, where TgBAC(mpx:EGFP)i114 positive cells are in green and operculum is in red. On the right side of the representative images, orthogonal projections of the planes (XY, YZ and XZ) marked with the yellow lines. Scale bar is 50 µm. (E) Percentage of adherent neutrophils at 6 dpf per opercular bone. Colors indicate the number of TgBAC(mpx:EGFP)i114 positive cells per operculum. For interpretation of the references to color in this figure legend, the reader is referred to the web version of this article. |