
|
Fig. 5
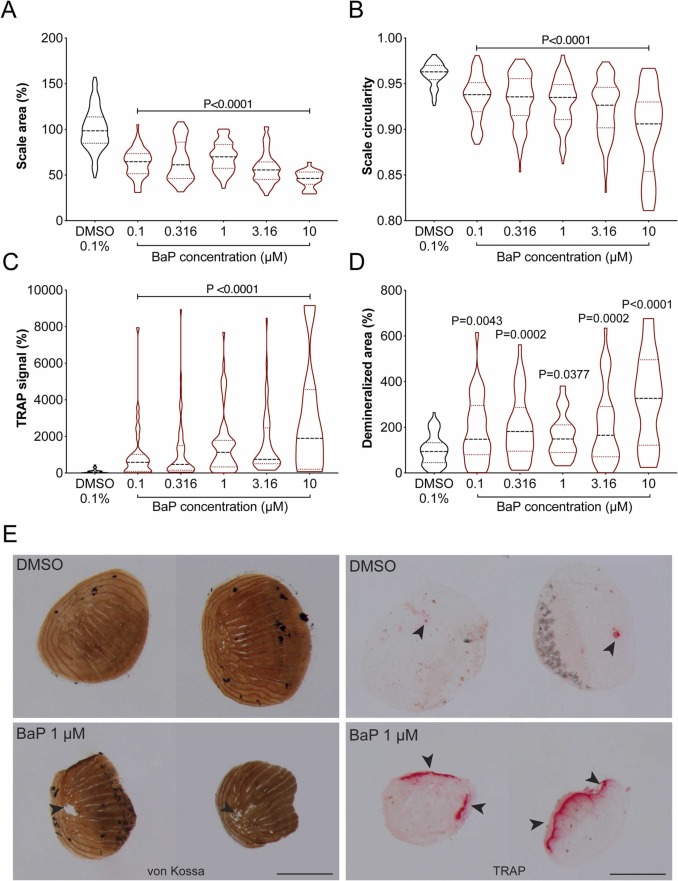
Fig. 5. Morphology, mineral content and osteoclast activity of regenerating scales from adult zebrafish exposed to increasing concentration of BaP for 5 days after plucking. (A) Scale area and (B) circularity were assessed through morphometric analysis of regenerating scales in bright-field images. (C) Osteoclast activity was assessed through TRAP (Tartrate-Resistant Acid Phosphatase) staining while (D) mineral content was evaluated through von Kossa staining. (E) Representative images of von Kossa (left panels) and TRAP (right panels) stained scales collected from adults exposed to either 0.1% DMSO or 1 μM BaP. Arrowheads point to demineralized areas or regions of TRAP signal. Scale bar is 0.5 mm. P-value calculated using Kruskal-Wallis test followed by Dunn's multiple comparisons test for TRAP activity and one-way ANOVA followed by Dunnett's multiple comparison test for scale area, scale circularity and demineralized area. Values are presented as median and quartiles (n ≥ 20; n = 9 at BaP 10 μM in Demineralized area). For interpretation of the references to color in this figure legend, the reader is referred to the web version of this article.