
- Title
-
Protective Effects and Mechanisms of Procyanidins on Parkinson's Disease In Vivo and In Vitro
- Authors
- Chen, J., Chen, Y., Zheng, Y., Zhao, J., Yu, H., Zhu, J., Li, D.
- Source
- Full text @ Molecules
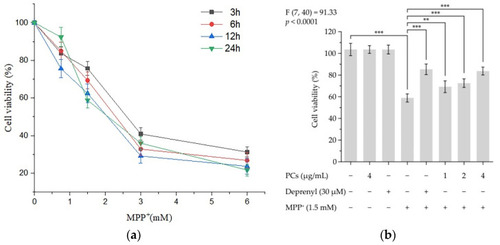
Figure 1. PCs on MPP+-induced cytotoxicity of PC12 cells. Cell viability was detected by CCK-8 assays. (a) Cytotoxic effects of MPP+ at different concentrations in PC12 cells; (b) PC-attenuated MPP+ induced decreases in cell viability. F and p values of the one-way analysis of variance are presented above the chart. The results of Tukey’s post hoc test are presented for selected comparisons: **, p < 0.01; ***, p < 0.001; the error bars are standard deviation (SD).
|
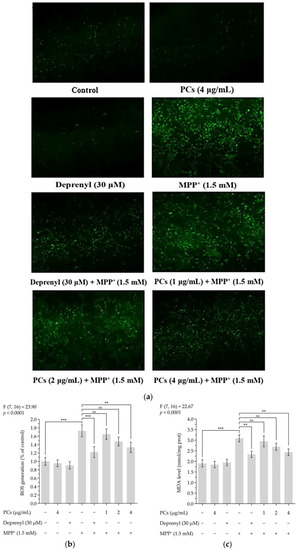
Figure 2. PCs reduced MPP+-induced oxidative stress and increased antioxidant enzyme activity. (a) ROS levels were measured by fluorescent microscopy and imaging analysis; (b) ROS levels were measured by image J software; (c) MDA levels; (d) GSH-Px activity; (e) CAT activity; (f) SOD activity. F and p values of the one-way analysis of variance are presented above each chart. The results of Tukey’s post hoc test are presented for selected comparisons: ns, p > 0.05; *, p < 0.05; **, p < 0.01; ***, p < 0.001; the error bars are SD.
|
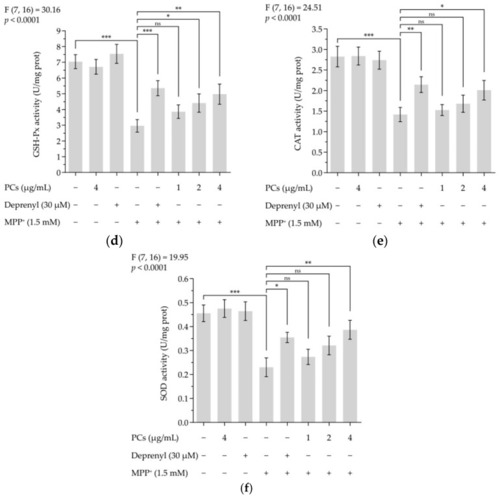
Figure 2. PCs reduced MPP+-induced oxidative stress and increased antioxidant enzyme activity. (a) ROS levels were measured by fluorescent microscopy and imaging analysis; (b) ROS levels were measured by image J software; (c) MDA levels; (d) GSH-Px activity; (e) CAT activity; (f) SOD activity. F and p values of the one-way analysis of variance are presented above each chart. The results of Tukey’s post hoc test are presented for selected comparisons: ns, p > 0.05; *, p < 0.05; **, p < 0.01; ***, p < 0.001; the error bars are SD.
|
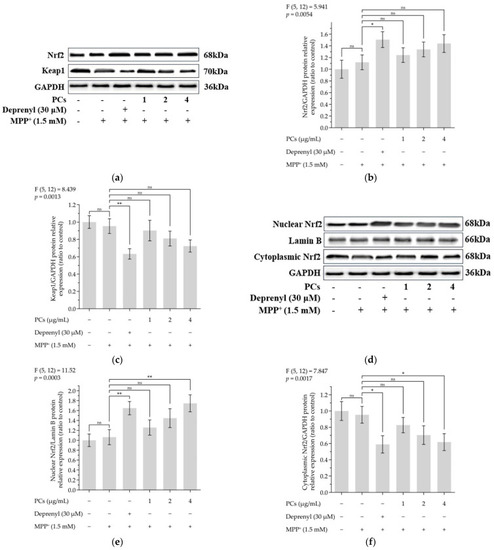
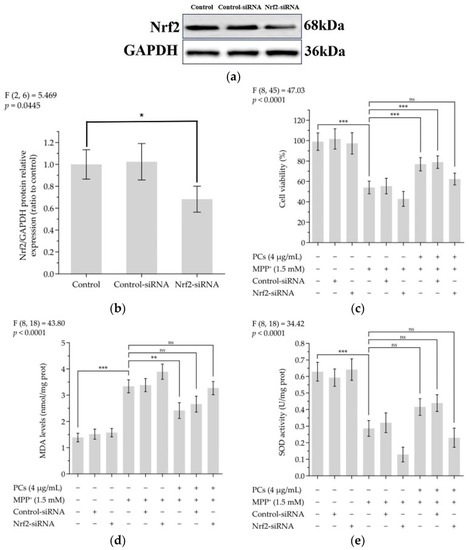
Figure 3. Effects of PCs on Nrf2/ARE pathway in MPP+-induced PC12 cells. (a) Protein levels of Nrf2 and Keap-1, as determined by Western blotting; (b) Nrf2/GAPDH protein relative expression (ratio to control); (c) Keap1/GAPDH protein relative expression (ratio to control); (d) protein expression levels of nuclear Nrf2 and cytoplasmic Nrf2, as determined by Western blotting; (e) nuclear Nrf2/LaminB protein relative expression (ratio to control); (f) cytoplasmic Nrf2/GAPDH protein relative expression (ratio to control); (g) protein levels of HO-1, NQO1, GCLC and GCLM, as determined by Western blotting; (h) HO-1/GAPDH protein relative expression (ratio to control); (i) NQO1/GAPDH protein relative expression (ratio to control); (j) GCLC/GAPDH protein relative expression (ratio to control); (k) GCLM/GAPDH protein relative expression (ratio to control). F and p values of the one-way analysis of variance are presented above each chart. The results of Tukey’s post hoc test are presented for selected comparisons: ns, p > 0.05; *, p < 0.05; **, p < 0.01; the error bars are SD.
|
Nrf2/ARE signaling is related to the neuroprotective and antioxidant effects mediated by PCs. ( |
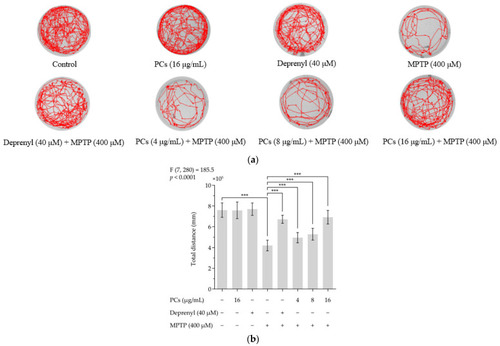
Effects of PCs on zebrafish larvae motility upon MPTP treatment. ( |
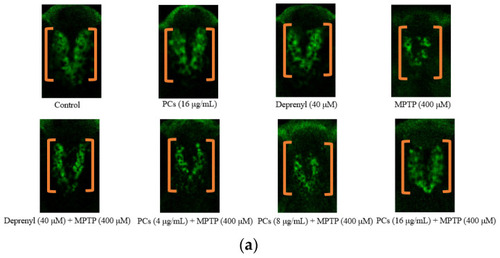
Figure 6. Effects of PCs on MPTP-induced dopaminergic neuron injury in zebrafish. (a) Representative pictures of the dopaminergic neurons in the brains of zebrafish; (b) number of TH+ neurons was measured by ImageJ. F and p values of the one-way analysis of variance are presented above the chart. The results of Tukey’s post hoc test are presented for selected comparisons on the chart: ns, p > 0.05; ***, p < 0.001; the error bars are SD.
|
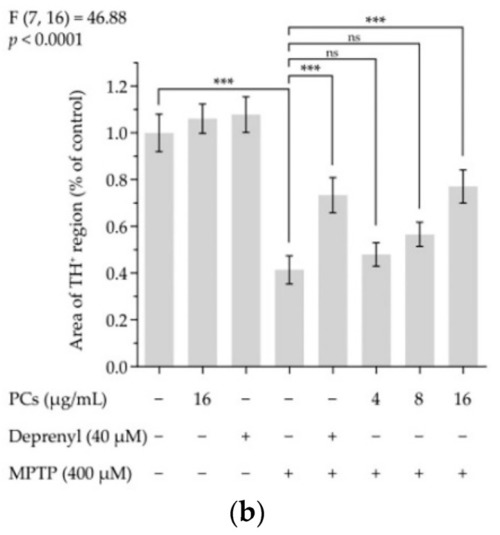
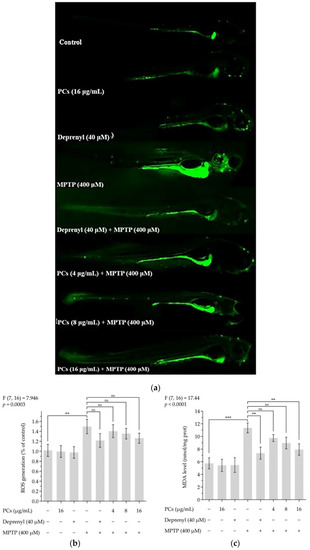
Figure 7. Effects of PCs on oxidative stress of zebrafish larvae treated with MPTP. (a) ROS levels were measured by fluorescent microscopy and imaging analysis; (b) ROS levels were measured via image J software; (c) MDA levels; (d) GSH-Px activity; (e) CAT activity; (f) SOD activity. F and p values of the one-way analysis of variance are presented above each chart. The results of Tukey’s post hoc test are presented for selected comparisons: ns, p > 0.05; *, p < 0.05; **, p < 0.01; ***, p < 0.001; the error bars are SD.
|
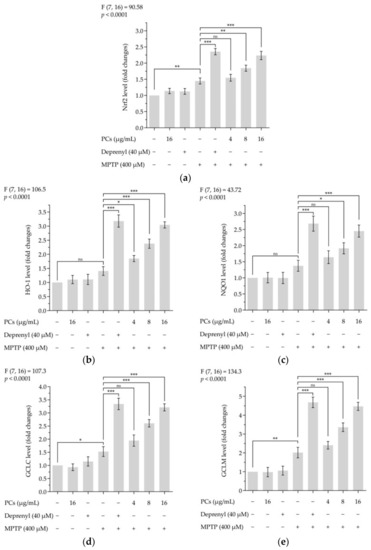
Effects of PCs on Nrf2/ARE pathway in MPTP-induced zebrafish larvae. ( |