
- Title
-
Genomic and physiological analyses of the zebrafish atrioventricular canal reveal molecular building blocks of the secondary pacemaker region
- Authors
- Abu Nahia, K., Migdał, M., Quinn, T.A., Poon, K.L., Łapiński, M., Sulej, A., Liu, J., Mondal, S.S., Pawlak, M., Bugajski, Ł., Piwocka, K., Brand, T., Kohl, P., Korzh, V., Winata, C.
- Source
- Full text @ Cell. Mol. Life Sci.
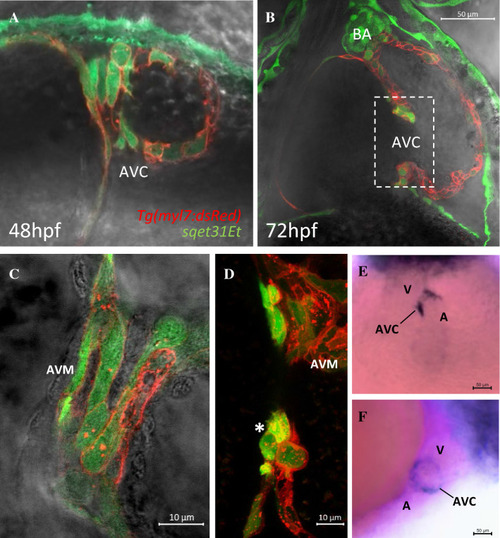
EGFP expression in the transgenic line sqet31Et defines cells of the AVC. A, B Confocal images showing the AVC region at 48 hpf and 72 hpf. Note the overlap between EGFP and mRFP signals, indicating extensive co-localization and confirming the largely myocardial nature of the EGFP expression domain in sqet31Et. C, D Close-up of the region marked in panel B at different focal planes showing the surface (C) and lumen (D) of the AVC. Note the group of three cuboidal cells protruding into the cardiac lumen at the location corresponding to the developing cardiac cushion (asterisk). E, F Whole-mount in situ hybridization of egfp in sqet31Et transgenic embryos at 72 hpf showing enrichment of EGFP expression in the AVC relative to the rest of the heart. E ventral, D lateral view, A atrium, V ventricle, AVC atrioventricular canal, BA bulbus arteriosus, AVM atrioventricular myocardium |
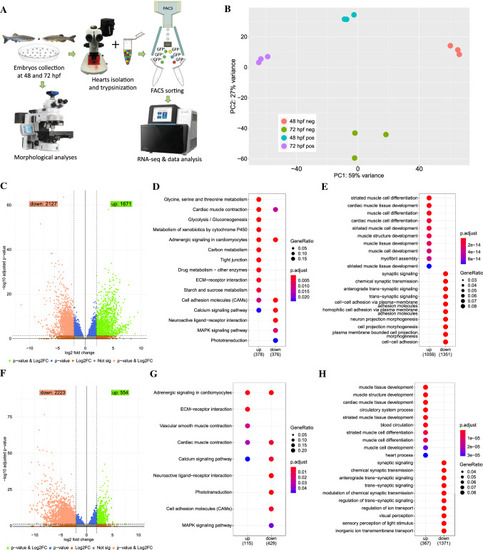
Transcriptome profiling of the GFP+ cells isolated from sqet31Et. A Scheme of experimental design. B Principal component analysis (PCA) on normalized RNA-seq data (regularized log) showing variance between three technical replicates of each sample as well as between samples. C, F Volcano plots showing genes differentially expressed between EGFP-positive and -negative cells at 48 hpf (C) and 72 hpf (F). DESeq2 was used to calculate log2FC and padj values. Green spots indicate genes considered as significant (padj < 0.05) with at least twofold change between groups (log2FC > 2). Accordingly, light red spots represent significant genes with log2FC smaller than -2. D, G KEGG pathway enrichment of differentially expressed genes at 48 hpf and 72 hpf. Enrichment analysis was performed on a gene list meeting the following criteria: log2FC > 2 or log2FC < -2 and padj < 0.05. Same criteria were used to perform biological process Gene Ontology terms enrichment on up- and down-regulated genes (E, H). Top ten terms for each enrichment analysis are shown |
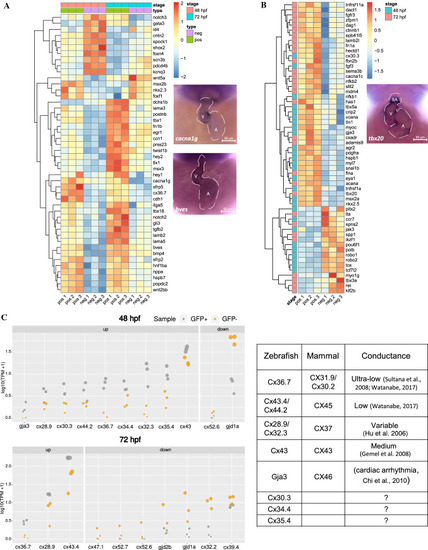
AVC gene signatures are enriched in sqet31Et EGFP-expressing cells. Signatures were retrieved from MGI and ZFIN databases and used to identify molecular markers associated with AVC expressed in the studied dataset (padj < 0.05). A Heatmap depicts the dynamic of changes of known molecular AVC signatures that are in common across the developmental stage. B AVC markers uniquely expressed in either 48 hpf or 72 hpf stage. C Expression (in log10(TPM + 1)) of genes encoding connexins, components of gap junctions which confer conductance properties between cells, in GFP+ and GFP− cells at 48 hpf and 72 hpf. Mammalian homologs of each connexin gene and their known conductance properties are described in the accompanying table |
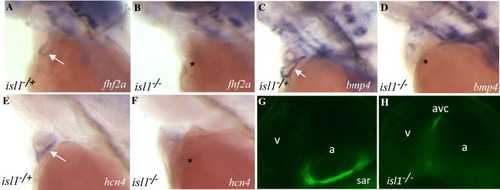
The absence of the pacemaker ring in isl1 mutant causes the loss of expression of fhf2, hcn4, bmp4. A–H Expression pattern (labeled with arrow) of fhf2a (A, B), bmp4 (C, D), hcn4 (E, F) and EGFP (G, H) in isl1 siblings and mutants. (A–F) WISH, (G, H) confocal microscopy of CCS in the sibling and isl1 mutant |
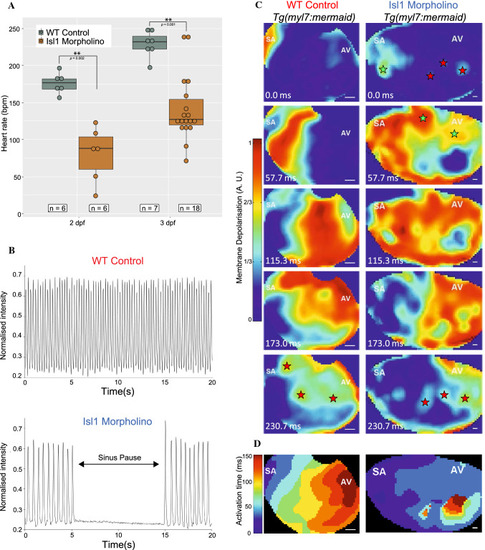
Effects of morpholino knockdown of isl1 on electrical activity of the atria in zebrafish larvae. A Heart rate at 48 hpf (left) and 72 hpf (right) in WT control (grey) and isl1 morphant (brown) zebrafish, showing slowed heart rate in isl1 morphants (Wilcoxon rank sum test with continuity correction, asterisks indicate p value ≤ 0.01). B Videographic analysis of the heartbeat in WT control (top) and isl1 morphant (bottom) 48 hpf zebrafish, showing slowed heart rate and sinus pauses (during the period indicated by the arrow) in the isl1 morphant. C Sequence of video frames showing electrical activation of the atria in WT control (left) and isl1 morphant (right) 48 hpf Tg(myl7:mermaid) zebrafish, showing normal activation (from the sinoatrial node region [SA] to the atrioventricular [AV] junction) and sites of latest activation/repolarisation (indicated by red stars) in the WT control and abnormal activation in the isl1 morphant (sites of early/ectopic activation in the morphant zebrafish indicated by green stars). D Isochronal activation map of the atria in WT control (left) and isl1 morphant (right) 48 hpf zebrafish derived from the video represented in (C) |
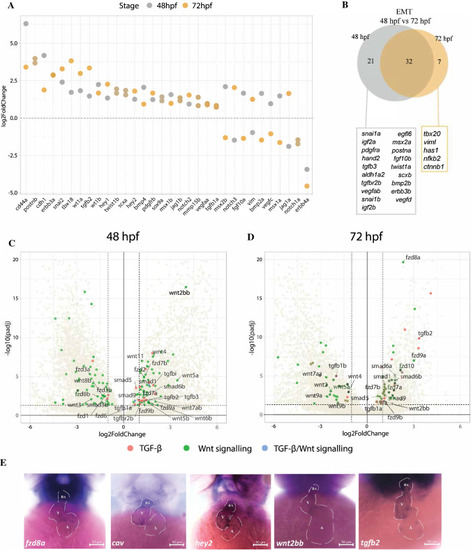
The transcripts of genes involved in EMT and valve development are enriched in the AVC. A AVC enrichment (expressed in log2-fold change between GFP + and GFP− cells, padj < 0.05) of genes known to regulate EMT at both 48 hpf and 72 hpf stages. B Overlap of EMT-regulating genes enriched in GFP+ cells at both stages. C, D Volcano plot showing enrichment of components of the TGF-β and Wnt signaling pathways in AVC at both 48 hpf and 72 hpf stages. E Whole mount in situ hybridization of several AVC-enriched genes of the TGF-β and Wnt pathway components |