
|
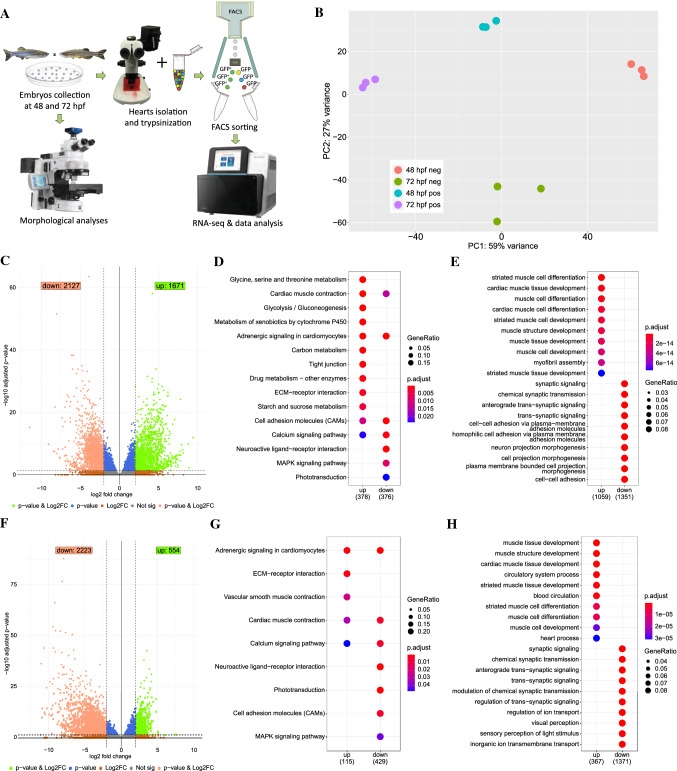
Fig. 2
Transcriptome profiling of the GFP+ cells isolated from sqet31Et. A Scheme of experimental design. B Principal component analysis (PCA) on normalized RNA-seq data (regularized log) showing variance between three technical replicates of each sample as well as between samples. C, F Volcano plots showing genes differentially expressed between EGFP-positive and -negative cells at 48 hpf (C) and 72 hpf (F). DESeq2 was used to calculate log2FC and padj values. Green spots indicate genes considered as significant (padj < 0.05) with at least twofold change between groups (log2FC > 2). Accordingly, light red spots represent significant genes with log2FC smaller than -2. D, G KEGG pathway enrichment of differentially expressed genes at 48 hpf and 72 hpf. Enrichment analysis was performed on a gene list meeting the following criteria: log2FC > 2 or log2FC < -2 and padj < 0.05. Same criteria were used to perform biological process Gene Ontology terms enrichment on up- and down-regulated genes (E, H). Top ten terms for each enrichment analysis are shown