
- Title
-
A simple and rapid method for enzymatic synthesis of CRISPR-Cas9 sgRNA libraries
- Authors
- Yates, J.D., Russell, R.C., Barton, N.J., Yost, H.J., Hill, J.T.
- Source
- Full text @ Nucleic Acids Res.

Schematic of the sgRNA Library Synthesis Method. Each step of the process is represented by a black arrow. Restriction enzyme binding sites are shown in black. Magnetic beads are represented as orange circles. (Step 1) DNA from an arbitrary source is fragmented by a restriction enzyme such as HpaII (CCGG) that contains the canonical PAM (NGG) in its recognition sequence. (Step 2) An adapter (blue) encoding a modified sgRNA sequence is ligated to the DNA fragments. The adapter is unphosphorylated, contains an MmeI recognition sequence, has a two base-pair, single-stranded overhang compatible with the fragmented DNA, and includes a long single-stranded overhang capable of hybridizing to a single-stranded oligo. (Step 3) A single-stranded capture oligonucleotide attached to a magnetic bead at the 3′ end is used to immobilize the adapter to magnetic beads through hybridization and excess DNA is washed away before digestion with MmeI to capture the spacer sequence. (Step 4) An unphosphorylated adapter containing the T7 promoter sequence (green) and a 3′ overhang containing all possible dinucleotides is ligated to the cleaved spacer sequence. (Step 5) The nicked library is detached from the beads by a strand displacing polymerase (yellow) and nicks are simultaneously repaired by the same mechanism. The detached double stranded oligonucleotides constitute an sgRNA library containing spacers targeting the DNA source and can be transcribed in vitro or cloned into plasmids for downstream applications. |

Incorporation of the MmeI Recognition Sequence into the Repeat:Anti-Repeat Duplex and Elution with a Strand Displacing Polymerase. (A) Modifications were made to the Repeat:Anti-Repeat Duplex of the sgRNA sequence to insert a single MmeI site that cleaves 18-20 bp upstream of the sgRNA recognition sequence. Modifications are shown in red. The MmeI binding sites are shown in dark gray boxes. The MmeI cut site is represented with a triangle. (B) in vitro Cas9 digestion of a 1000 bp DNA fragment with each sgRNA variant. (C) Injection of zebrafish embryos with Cas9 and the sgRNA variant targeting the gol gene compared to an uninjected control (minimum n per pool = 150). (D) Detachment of the sgRNA scaffold from magnetic beads using Bst 3.0 or Pol1. |

Comparison of genome-wide SLOLAM library to the GeCKOv1, GeCKOv2, and Brunello sgRNA Libraries. (A) Comparison of key library statistics. (B) Boxplot comparison of the Rule Set 2 predicted efficiency scores for each library. (C) Comparison of the CFD scores for each library. (D) Boxplot comparison of the Rule Set 2 predicted efficiency scores of the top 3 sgRNAs per gene. (E) Comparison of the CFD scores for the top 3 sgRNAs per gene. In both boxplots, horizontal lines in the boxes indicate the 25th, 50th and 75th percentile, and the whiskers indicate the 5th and 95th percentile. |

GFP Knockout Screen. (A) Genomic DNA was isolated from HeLa cells stably expressing GFP-LC3. The four HpaII sites within the GFP ORF and the predicted sgRNAs are labeled. (B) FACS sorting of transfected and untransfected cells. GFP fluorescence is on the x-axis and counts are on the y-axis. (C) Mutation frequency at each of the HpaII sites based on high-throughput sequencing of the GFP locus. (D) The most common variants for each of the four HpaII sites. |
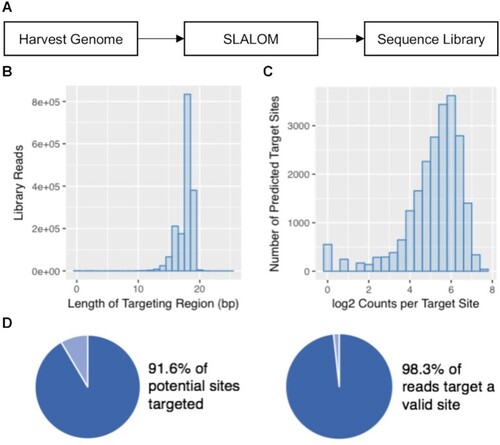
High-throughput sequencing of a SLALOM-generated sgRNA library to the E. coli MG1655 genome. (A) Schematic diagram of the library generation process. (B) Histogram showing the distribution of spacer lengths within the library. (C) Histogram showing representation of each sgRNA target in the library. (D) Analysis showing the coverage and purity of the library. |
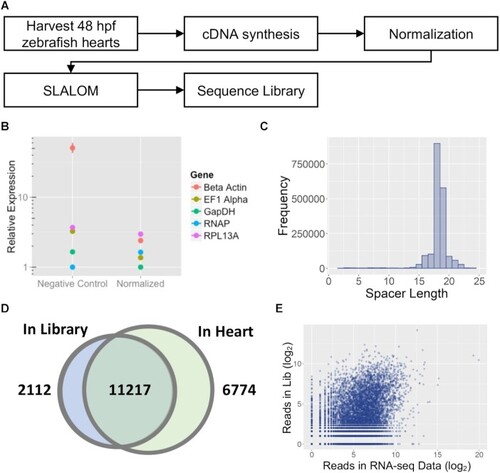
High-throughput sequencing of a SLALOM-generated sgRNA library to normalized cDNA extracted from 48 hpf zebrafish hearts. (A) Schematic diagram of the library generation process. B) Results of qPCR analysis on five genes with varying expression levels in the endogenous tissue before and after cDNA normalization. (C) Histogram showing the distribution of spacer lengths within the library. (D) Venn diagram of the genes targeted by at least one spacer in the library compared to genes detected in the 48 hpf zebrafish heart by RNA-seq. A threshold of 1 read per gene was used to designate both genes and spacers as ‘detected’. (E) Comparison of the total number of spacer reads vs. expression level in an RNA-seq dataset for 48 hpf zebrafish hearts. |