
Image
|
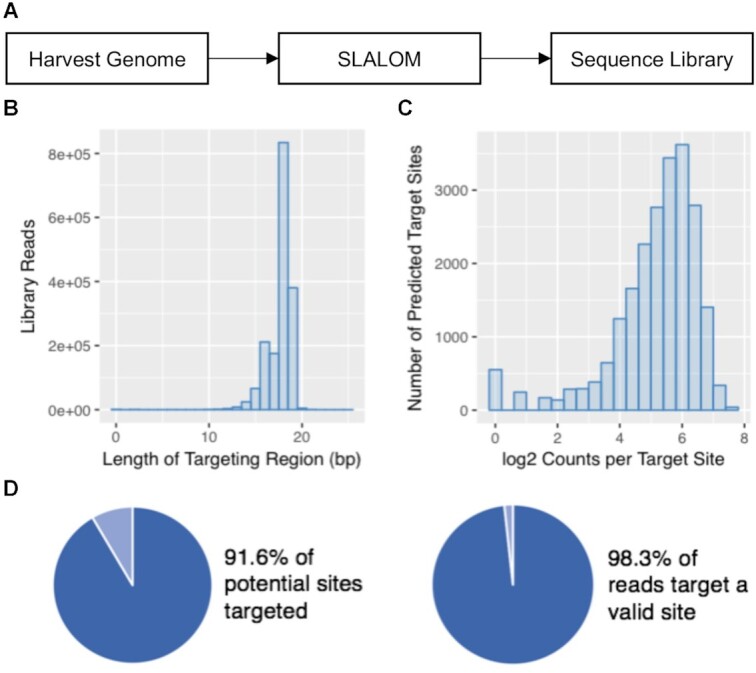
Figure Caption
Fig. 5
High-throughput sequencing of a SLALOM-generated sgRNA library to the E. coli MG1655 genome. (A) Schematic diagram of the library generation process. (B) Histogram showing the distribution of spacer lengths within the library. (C) Histogram showing representation of each sgRNA target in the library. (D) Analysis showing the coverage and purity of the library.
Acknowledgments
This image is the copyrighted work of the attributed author or publisher, and
ZFIN has permission only to display this image to its users.
Additional permissions should be obtained from the applicable author or publisher of the image.
Full text @ Nucleic Acids Res.