
- Title
-
Suppressing STAT3 activity protects the endothelial barrier from VEGF-mediated vascular permeability
- Authors
- Wang, L., Astone, M., Alam, S.K., Zhu, Z., Pei, W., Frank, D.A., Burgess, S.M., Hoeppner, L.H.
- Source
- Full text @ Dis. Model. Mech.
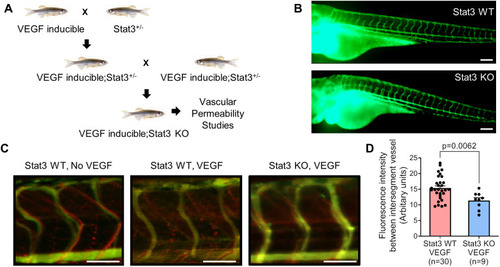
VEGF-induced vascular permeability is reduced upon CRISPR/Cas9-mediated knockout of Stat3 in zebrafish. (A) VEGF-inducible zebrafish were crossed to Stat3+/− (heterozygous) zebrafish to generate VEGF-inducible; Stat3+/− double transgenic fish, which were intercrossed to generate VEGF-inducible; Stat3−/− (KO) zebrafish. (B) CRISPR/Cas9-generated Stat3 KO zebrafish (bottom) display no overt vascular defects relative to wild-type (WT) zebrafish (top). The vascular system of 3 days post-fertilization (dpf) zebrafish was visualized by microangiography with 2000 kDa FITC-dextran. Representative images of at least three zebrafish per group are shown. Scale bars: 100 μm. (C) Microangiography using 70 kDa Texas Red-dextran permeabilizing tracer (red) and 2000 kDa FITC-dextran intersegmental vessel marker (green) was performed on 3 dpf Stat3+/+ (negative controls without VEGF induction; left), VEGF-induced, Stat3+/+ (middle) and VEGF-induced, Stat3−/− (right) zebrafish. Representative images shown were obtained using a Zeiss Apotome 2 microscope with a Fluar 5×/0.25 NA lens at room temperature (RT). Scale bars: 50 μm. (D) Quantitative analysis of vascular permeability upon VEGF stimulation in WT Stat3+/+ (n=30) and KO Stat3−/− (n=9) zebrafish. Mean±s.e.m., unpaired, two-tailed Student's t-test. |
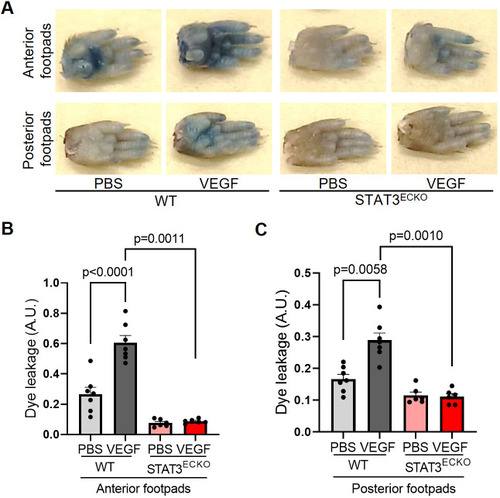
Endothelial cell-specific STAT3 knockout mice exhibit decreased VEGF-induced permeability. (A) Images of footpads from WT and endothelial cell-specific STAT3 knockout (STAT3ECKO) mice following tail vein injection with 1% Evans Blue dye and human recombinant VEGF-165 protein (2.5 µg/ml; left footpads) or PBS vehicle (right footpads) being injected into the root of the footpad. (B,C) Quantitation of Evans Blue leakage in Tie2-Cre negative; STAT3flox/flox (WT) and Tie2-Cre positive; STAT3flox/flox (STAT3ECKO) mice. n=7 mice in WT group and n=6 mice in STAT3ECKO group. Each mouse was injected with PBS on the right anterior and posterior footpads and VEGF on the left anterior and posterior footpads. Multiple biological replicates were performed and depicted findings are representative. Mean±s.e.m., one-way ANOVA followed by Bonferroni test. A.U., arbitrary units. |
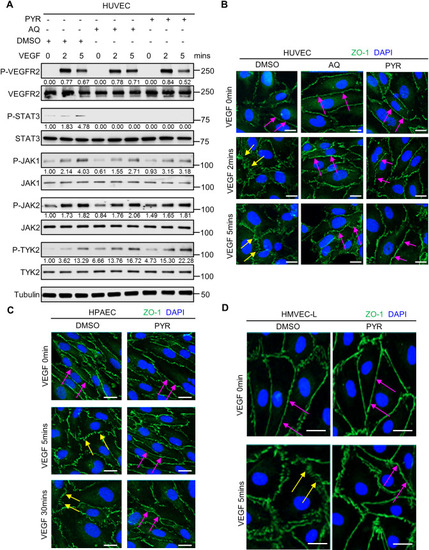
Pharmacological inhibition of STAT3 stabilizes endothelial barrier integrity following VEGF stimulation in human endothelial cells. (A) Serum-starved human umbilical vein endothelial cells (HUVECs) were pretreated with DMSO (vehicle control) for 1 h, 30 µM AQ for 4 h, or 10 µM PYR for 1 h prior to VEGF (25 ng/ml) stimulation for 0, 2 or 5 min. Lysates were immunoblotted. Densitometry was performed, and the values below the rows of bands represent the ratio of phosphorylated protein to respective total protein. (B) Human VEGF-165 recombinant protein (VEGF; 25 ng/ml) stimulation of HUVECs promotes ZO-1 (green) disorganization at endothelial cell junctions (yellow arrows; left column; DMSO vehicle control pretreatment for 1 h prior to VEGF stimulation). ZO-1 organization is maintained upon pretreatment with 30 μM AQ for 4 h (magenta arrows; middle column) or 10 μM PYR for 1 h (magenta arrows; right column) prior to VEGF stimulation. Nuclei were stained with DAPI (blue). (C) Serum-starved human pulmonary artery endothelial cells (HPAECs) were pretreated with 10 µM PYR for 1 h prior to VEGF (25 ng/ml) stimulation for 0, 5 or 30 min. VEGF stimulation promotes disorganization of ZO-1 (green) at endothelial cell junctions (yellow arrows). ZO-1 organization is maintained when HPAECs were pretreated with PYR (magenta arrows). Nuclei were stained with DAPI (blue). (D) VEGF (25 ng/ml) stimulation of human lung microvascular endothelial cells (HMVEC-Ls) promotes ZO-1 (green) disorganization at endothelial cell junctions (yellow arrows). ZO-1 organization is maintained upon pretreatment with 20 μM PYR for 6 h prior to VEGF stimulation (magenta arrows). Nuclei were stained with DAPI (blue). At least two biological replicates were performed for each experiment depicted in A-D. Scale bars: 20 µm. |
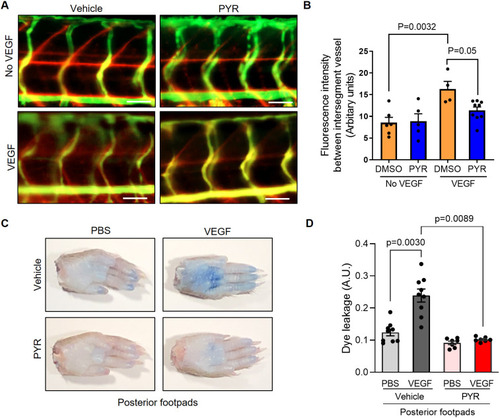
Suppression of STAT3 activity by pyrimethamine (PYR) inhibits VEGF-induced vascular permeability in zebrafish and mice. (A) Microangiography using 70 kDa Texas Red-dextran permeabilizing tracer (red) and 2000 kDa FITC-dextran intersegmental vessel marker (green) was performed on 3 dpf zebrafish without induced VEGF pretreated with DMSO (n=6) or 25 μM PYR (n=5) or 3 dpf zebrafish with induced VEGF pretreated with DMSO (n=4) or 25 μM PYR (n=9) for 3 days. Representative images shown were obtained using a Zeiss Apotome 2 microscope with a Fluar 5×/0.25 NA lens at RT. Scale bars: 50 μm. (B) The quantitative analysis of vascular permeability without VEGF stimulation or upon VEGF stimulation in zebrafish pretreated with DMSO or PYR. Mean±s.e.m., one-way ANOVA followed by Bonferroni test. (C) Representative images of footpads from mice treated with vehicle or PYR following tail vein injection with 1% Evans Blue and footpad injection of VEGF (2.5 μg/ml) or PBS vehicle. (D) Quantitation of Evans Blue dye leakage in C57BL/6 WT mice treated with vehicle or PYR. n=9 mice in the vehicle group and n=7 mice in the PYR group. Each mouse was injected with PBS in the right posterior footpad and VEGF in the left posterior footpad. Multiple biological replicates were performed and depicted findings are representative. Mean±s.e.m., one-way ANOVA followed by Bonferroni test. |
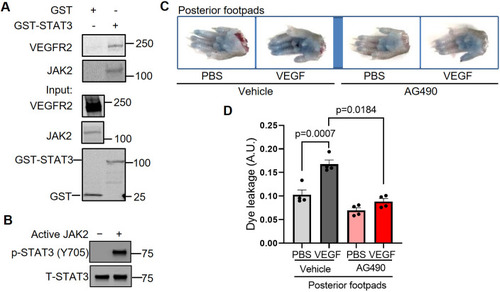
JAK2 phosphorylates STAT3 to transduce VEGF/VEGFR-2 signaling and promote vascular permeability. (A) To perform a STAT3 GST pull-down of VEGFR-2 and JAK2, lysates of HUVECs stimulated with serum for 30 min were used as prey. GST fusion protein STAT3 expressed in 293F cells was used as bait. GST alone served as a negative control. Binding experiments were analyzed by SDS-PAGE and visualized by immunoblotting. GST-STAT3 and GST were each detected using an anti-GST antibody. Three biological replicates were performed and depicted findings are representative. (B) JAK2 phosphorylates STAT3 in vitro. In vitro kinase assays were performed using purified human STAT3 protein and kinase active JAK2 protein. The results shown here are representative of two independent experiments. (C) Representative images of footpads from C57BL/6 WT mice treated with vehicle or JAK2 inhibitor AG490. Following tail vein injection with 1% Evans Blue dye, human VEGF-165 protein (2.5 μg/ml) or PBS vehicle was injected into the root of the footpad. After 30 min, the mice were euthanized and the footpads were excised. (D) Quantitation of Evans Blue dye leakage in C57BL/6 mice treated with vehicle or AG490. n=4 mice per group. Each mouse was injected with PBS in the right posterior footpad and VEGF in the left posterior footpad. Two biological replicates were performed and depicted findings are representative. Mean±s.e.m., one-way ANOVA followed by Bonferroni test. |
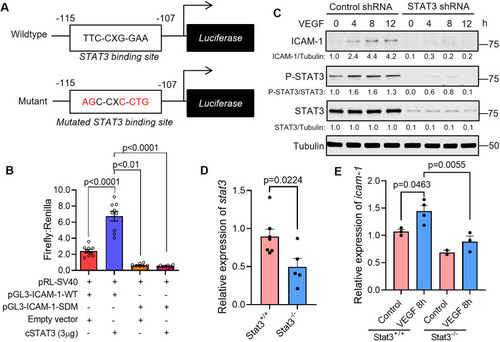
STAT3 transcriptionally activates ICAM-1, a cell adhesion molecule that promotes vascular permeability. (A) Top: the pGL3-ICAM1-WT plasmid containing the human ICAM-1 promoter with a STAT3 binding site located at −115 to −107 bp. Bottom: the pGL3-ICAM1-SDM plasmid with a site-directed mutation (SDM) in the STAT3 binding site as indicated. (B) Dual luciferase assays were performed in HUVECs that were transfected with pGL3-ICAM1-WT or pGL3-ICAM1-SDM and empty vector or constitutively active STAT3. Firefly and Renilla luminescence was measured and plotted as a ratio. Mean±s.e.m., one-way ANOVA followed by Bonferroni test. n=9 technical replicates. Depicted findings are representative of three independent experiments. (C) HUVECs that had been stably transduced with lentivirus encoding STAT3-specific shRNA or control shRNA were stimulated with human VEGF-165 protein (25 ng/ml) and the lysates were immunoblotted for ICAM1, p-STAT3 (Y705) and total STAT3. Depicted data are representative of three biological replicates. (D) RNA was harvested from VEGF; Stat3+/+ or VEGF; Stat3−/− 3 dpf embryos for quantitative PCR. stat3 transcripts are reduced in VEGF; Stat3−/− (n=5) compared to VEGF; Stat3+/+ zebrafish (n=7). Mean±s.e.m., unpaired, two-tailed Student's t-test. (E) The expression of icam-1 was assessed by real-time quantitative PCR using RNA derived from each zebrafish embryo in the absence of VEGF induction (Stat3+/+, n=3; Stat3−/−, n=2) or 8 h following VEGF induction (Stat3+/+, n=4; Stat3−/−, n=3) in the heat-inducible VEGF; Stat3 mutant zebrafish. Mean±s.e.m., one-way ANOVA followed by Bonferroni test. |