
|
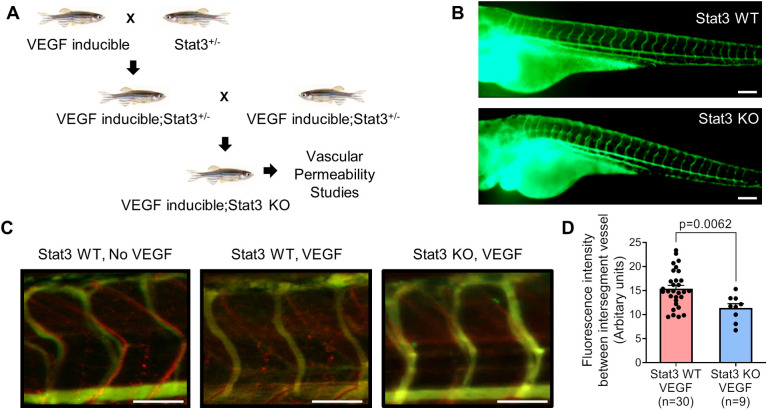
Fig. 1.
VEGF-induced vascular permeability is reduced upon CRISPR/Cas9-mediated knockout of Stat3 in zebrafish. (A) VEGF-inducible zebrafish were crossed to Stat3+/− (heterozygous) zebrafish to generate VEGF-inducible; Stat3+/− double transgenic fish, which were intercrossed to generate VEGF-inducible; Stat3−/− (KO) zebrafish. (B) CRISPR/Cas9-generated Stat3 KO zebrafish (bottom) display no overt vascular defects relative to wild-type (WT) zebrafish (top). The vascular system of 3 days post-fertilization (dpf) zebrafish was visualized by microangiography with 2000 kDa FITC-dextran. Representative images of at least three zebrafish per group are shown. Scale bars: 100 μm. (C) Microangiography using 70 kDa Texas Red-dextran permeabilizing tracer (red) and 2000 kDa FITC-dextran intersegmental vessel marker (green) was performed on 3 dpf Stat3+/+ (negative controls without VEGF induction; left), VEGF-induced, Stat3+/+ (middle) and VEGF-induced, Stat3−/− (right) zebrafish. Representative images shown were obtained using a Zeiss Apotome 2 microscope with a Fluar 5×/0.25 NA lens at room temperature (RT). Scale bars: 50 μm. (D) Quantitative analysis of vascular permeability upon VEGF stimulation in WT Stat3+/+ (n=30) and KO Stat3−/− (n=9) zebrafish. Mean±s.e.m., unpaired, two-tailed Student's t-test.