
- Title
-
Retinal ganglion cell survival after severe optic nerve injury is modulated by crosstalk between JAK/STAT signaling and innate immune responses in the zebrafish retina
- Authors
- Chen, S., Lathrop, K.L., Kuwajima, T., Gross, J.M.
- Source
- Full text @ Development

Zebrafish RGCs are preserved after optic nerve transection. (A) Immunolabeling of RGCs in the GCL with zn-8 (magenta) in the adult isl2b:GFP (green) retinae. Shown are a retinal cross section (20×) and high magnification view of the GCL (40×). Quantification revealed that ∼65% of DAPI (blue)-stained RGCs were isl2b:GFP+ (n=xxx). Scale bars: 100 μm (20×); 50 μm (40×). (B) Overview of ONT and RGC survival analyses. (C) Images of flat-mount retinae at 1, 3, 7 and 14 dpi. Scale bar: 50 μm. (D) RGC survival percentages at 1, 3, 7 and 14 dpi (n=6/day). Graphs show mean±s.d.; *P<0.05; **P<0.01; ***P<0.001; Kruskal–Wallis ANOVA with Dunn's multiple comparisons. Data derived from three experiments. |
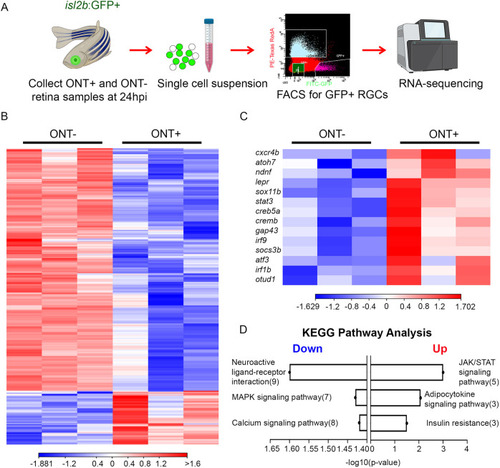
Identification of DEGs in isl2b:GFP+ RGCs after ONT. (A) Experimental workflow for FACS-isolation of isl2b:GFP+ RGCs. An example FACS plot showing a cell-sorting gate is included. Icons were adapted from BioRender.com. Number of experiments=1. (B) Heatmap showing hierarchical clustering of 308 DEGs at 24 hpi from three biological replicates. (C) Heatmap highlighting DEGs of interest based on known neuroprotective and pro-regenerative functions. Heatmap legends show log2TPM. (D) Pathway enrichment analysis using the KEGG database showing top-3 down- and upregulated pathways after ONT. |
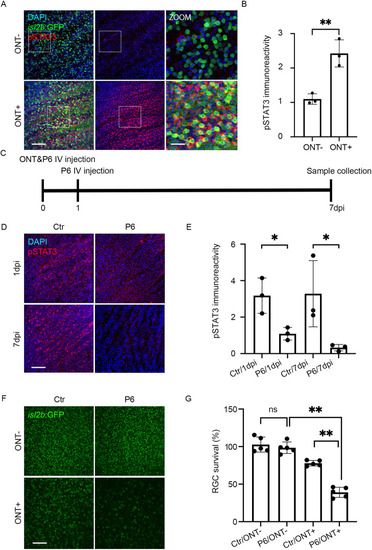
Jak/Stat pathway activity is required for RGC survival after ONT. (A) pStat3 expression (red) in flat-mount isl2b:GFP ONT− and ONT+ retinae at 1 dpi. Nuclei are stained with DAPI (blue). Right-hand panels show 3× magnifications of the boxed regions in the 40× images. (B) Quantification of pStat3 levels at 1 dpi. pStat3 levels in ONT+ RGCs are shown relative to those in ONT− retinae. Shown are mean±s.d. of n=3 for each group; **P<0.01; Mann–Whitney test. Data derived from three experiments. (C) Experimental protocol to assess Jak requirement for RGC survival after ONT. (D) pStat3 expression in ONT+ isl2b:GFP retinal flat mounts at 1 and 7 dpi with or without IV injection of the Jak inhibitor P6. DMSO was used as control (Ctr). (E) Quantification of pStat3 expression after P6 application at 1 and 7 dpi. n=3/condition. Shown are mean±s.d.; *P<0.05, Mann–Whitney test. Data derived from three experiments. (F) Images of P6- or DMSO-injected flat-mount isl2b:GFP retinae at 7 dpi. (G) Quantification of RGC survival after P6 injection (n=5/condition). Shown are mean±s.d.; **P<0.01; Kruskal–Wallis ANOVA with Dunn's multiple comparisons. Scale bars: 50 μm (A, main panels; D,F); 150 μm (A, zoom). Data derived from four experiments. |
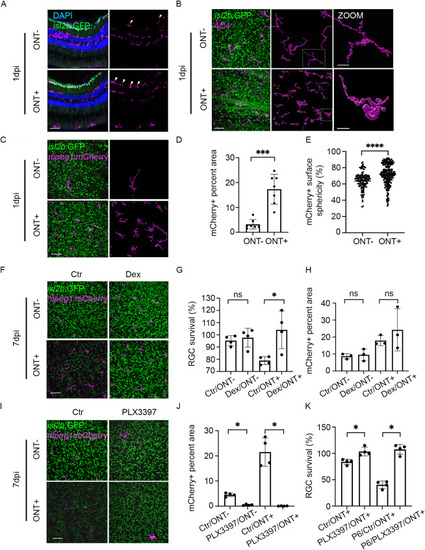
Macrophages/microglia are recruited to the GCL after ONT and mediate RGC death. (A,B) Immunostaining of 4C4 (magenta) on isl2b:GFP retinal cryosections (A) and retinal flat mounts at 1 dpi with surface renderings of 4C4+ macrophages/microglia generated in Imaris (B). (C) Images of retinal flat-mounts from isl2b:GFP;mpeg1:mCherry animals at 1 dpi. mCherry+ macrophages/microglia (magenta) surfaces were rendered in Imaris. (D) Quantification of the surface area within the GCL occupied by mCherry+ macrophages/microglia at 1 dpi (n=7/condition). Shown are mean±s.d.; ***P<0.001; Mann–Whitney test. Data derived from one experiment. (E) Violin plot showing a significant increase in sphericity of mCherry+ macrophages/microglia in ONT+ retinae compared with ONT− controls (n=140 in ONT− and n=272 in ONT+). ****P<0.0001; unpaired t-test with Welch's correction. (F) Flat-mount images of isl2b:GFP;mpeg1:mCherry retinae after IV injection of dexamethasone (Dex) or DMSO (Ctr) at 7 dpi. (G) RGC survival in dexamethasone-treated retinae increased significantly at 7 dpi compared with control (n=4/condition). Shown are mean±s.d.; *P<0.05; Kruskal–Wallis ANOVA test with Dunn's multiple comparisons. Data derived from three experiments. (H) Quantification of mCherry+ macrophage/microglia coverage of the GCL after ONT and dexamethasone or DMSO injection (n=3/condition). Shown are mean±s.d.; Kruskal–Wallis ANOVA test with Dunn's multiple comparisons. No significant differences were detected. Data derived from three experiments. (I) Flat-mount images of isl2b:GFP;mpeg1:mCherry retinae after PLX3397 treatment or housed in system water (Ctr) at 7 dpi. (J) Quantification of mCherry+ macrophage/microglia coverage of the GCL after ONT and PLX3397 treatment (n=4/condition). Shown are mean±s.d.; *P<0.05; Kruskal–Wallis ANOVA test with Dunn's multiple comparisons. Data derived from three experiments. (K) RGC survival in PLX3397-treated retinae increased significantly at 7 dpi compared with control. Similarly, RGC survival in PLX3397-treated retinae increased significantly after P6 addition compared with DMSO controls (n=4/condition). Shown are mean±s.d.; *P<0.05; Mann–Whitney test. Data derived from three experiments. Scale bars: 50 μm. ns, not significant. |