
Image
|
Figure Caption
Fig. 2
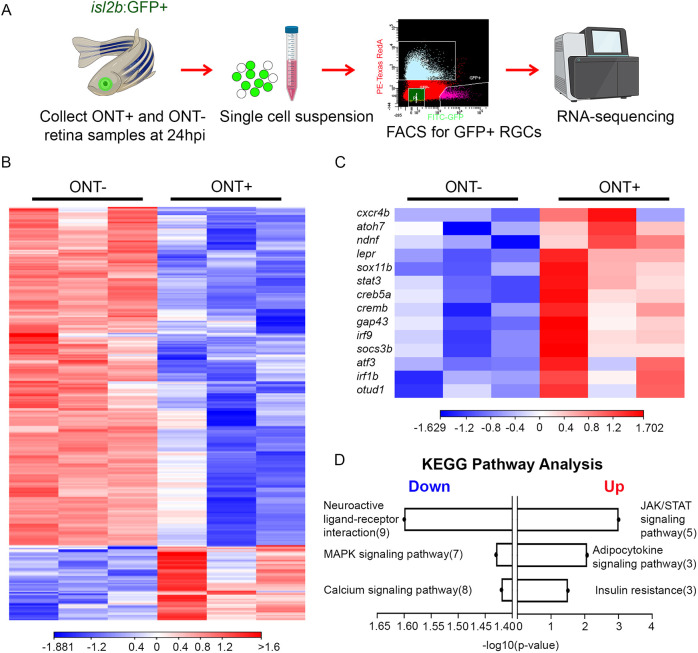
Identification of DEGs in isl2b:GFP+ RGCs after ONT. (A) Experimental workflow for FACS-isolation of isl2b:GFP+ RGCs. An example FACS plot showing a cell-sorting gate is included. Icons were adapted from BioRender.com. Number of experiments=1. (B) Heatmap showing hierarchical clustering of 308 DEGs at 24 hpi from three biological replicates. (C) Heatmap highlighting DEGs of interest based on known neuroprotective and pro-regenerative functions. Heatmap legends show log2TPM. (D) Pathway enrichment analysis using the KEGG database showing top-3 down- and upregulated pathways after ONT.
Acknowledgments
This image is the copyrighted work of the attributed author or publisher, and
ZFIN has permission only to display this image to its users.
Additional permissions should be obtained from the applicable author or publisher of the image.
Full text @ Development