FIGURE SUMMARY
Title

Deletion of lrrk2 causes early developmental abnormalities and age-dependent increase of monoamine catabolism in the zebrafish brain

Authors
Suzzi, S., Ahrendt, R., Hans, S., Semenova, S.A., Chekuru, A., Wirsching, P., Kroehne, V., Bilican, S., Sayed, S., Winkler, S., Spieß, S., Machate, A., Kaslin, J., Panula, P., Brand, M.
Source
Full text @ PLoS Genet.

Homology between the human LRRK2 and the zebrafish Lrrk2 proteins and generation of the zebrafish <italic toggle='yes'>lrrk2</italic><sup><italic toggle='yes'>tud113</italic></sup> allele.

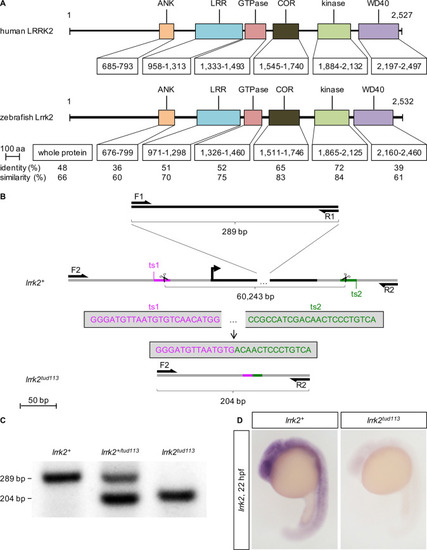
(A) Alignment of the whole sequence and the individual domains of human LRRK2 (NP_940980) and zebrafish Lrrk2 (NP_001188385) proteins revealed a high degree of conservation of the catalytic core. The percentages of identity (same residues at the same positions in the alignment) and similarity (identical residues plus conservative substitutions) are indicated. Abbreviations: aa, amino acids; ANK, ankyrin domain; COR, C-terminal of Ras of complex proteins; LRR, leucine-rich repeat domain. (B) Scheme reproducing the lrrk2 gene targeting and screening strategy. The lrrk2 open reading frame (ORF) is highlighted in black; F1, R1: lrrk2 ORF-specific primers; F2, R2: lrrk2 ORF-flanking primers; ts1 (magenta), ts2 (green): gRNA target sites (ts); bp, base pairs. (C) gap-PCR analysis of genomic DNA from wild-type (lrrk2+), heterozygous (lrrk2+/tud113), and homozygous mutant (lrrk2tud113) individuals. F1 and R1 amplify a 289-base pairs-long product, F2 and R2 a 204-base pairs-long product. (D) lrrk2 ISH confirming the complete absence of lrrk2 expression in 22-hpf lrrk2tud113 embryos.

EXPRESSION / LABELING:
Gene:
Fish:
Anatomical Term:
Stage: 26+ somites
PHENOTYPE:
Fish:
Observed In:
Stage: 26+ somites

Early but transient neurodevelopmental phenotypes in mzLrrk2 larvae.

(A and B) Increased cell death in the brains of mzLrrk2 larvae (5 dpf) as revealed by TUNEL assay. Quantification was carried out over the whole brain, subdivided into anterior (telencephalon), middle (diencephalon, mesencephalon), and posterior (rhombencephalon) portions. (A) Scale bar: 100 μm. (B) Plot represents means ± s.e.m. Statistical analyses: two-tailed Student’s t-test. (C-E) No evidence of midbrain neurodegeneration in mzLrrk2 larvae (5 dpf). HuC/D IHC (C-top and D) and acetylated (Ac.) Tubulin IHC (C-bottom and E) were used to label postmitotic neurons and axonal network. (C) Scale bar: 100 μm. (E) IR, immunoreactivity (measured as integrated density). (D and E) Plots represent means ± s.e.m. Statistical analyses: two-tailed Student’s t-test. (F-H) Claudin k+ myelinated commissural fibers in the ventral hindbrain were reduced in mzLrrk2 larvae (5 dpf; F and G), but not in youngsters (1 mo; H; representative images in S6 Fig). (F) Scale bar: 100 μm. (H) IR, immunoreactivity (measured as integrated density). (G and H) Plots represent means ± s.e.m. Statistical analyses: two-tailed Student’s t-test. (I-K) L-Plastin+ microglia/leukocytes were reduced in the brains of mzLrrk2 larvae (5 dpf; I and J), but not in the brains of adult fish (6 mo; K, quantification in the telencephalon as representative brain region; representative images in S8 Fig). (I) Scale bar: 100 μm. (J) Quantification of microglia/leukocytes in the larval brain was performed after image segmentation as depicted in S7A–S7D Fig. (J and K) Plots represent means ± s.e.m. Statistical analyses: two-tailed Student’s t-test.

Population-specific defects in the CA system of mzLrrk2 larvae.

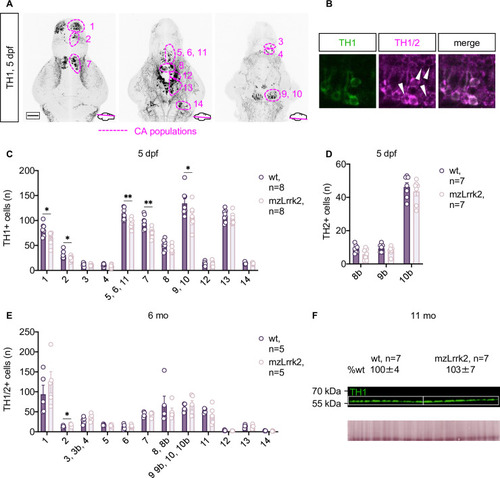
(A) The zebrafish CA cell populations in the rostro-caudal axis from the olfactory bulb to the locus cæruleus as revealed by tyrosine hydroxylase 1 (TH1) IHC at 5 dpf. Pop. 1: olfactory bulb; pop. 2: telencephalic complex; pop. 3: preoptic area, pars anterior; pop. 4: preoptic area, pars posterior; pop. 5, 6, 11: diencephalic complex; pop. 7: pretectal area; pop. 8: paraventricular organ, pars anterior; pop. 9: paraventricular organ, pars intermedia; pop. 10: paraventricular organ, pars posterior; pop. 12: posterior tuberal nucleus/posterior tuberculum; pop. 13: hypothalamic complex; pop. 14: locus cæruleus. (B) Combination of the anti-TH1 antibody with the pan-TH antibody allows the identification of TH2+ cells (white arrowheads) by exclusion. TH2+ cells are found within the TH1 pop. 8, 9, and 10 in the paraventricular organ, thereby constituting the TH2 pop. 8b, 9b, 10b. (C and D) Quantification of TH1+ (C) and TH2+ cells (D) revealed defects in distinct CA cell populations in the brain of mzLrrk2 larvae (5 dpf). Plot represents means ± s.e.m. Statistical analyses: (C: pop. 2–14 and D) two-tailed Student’s t-test; (C: pop. 1) two-tailed Mann-Whitney’s U-test. (E) Quantification of TH1/2+ cells in the adult brain (6 mo) revealed absence of CA cell defects in mzLrrk2 fish. Plot represents means ± s.e.m. Statistical analyses: (E: pop.1, E: pop. 3–11, E: pop. 13 and E: pop. 14) two-tailed Student’s t-test; (E: pop. 2 and E: pop. 12) two-tailed Mann-Whitney’s U-test. (F) Quantification of TH1 protein levels in 11-mo brains shows intact CA system in adult fish; total protein stain as loading control is shown. Protein levels are reported as means ± s.e.m. relative to wt levels (%). Statistical analysis: two-tailed Student’s t-test.

Age-dependent perturbation of monoamine catabolism in the mzLrrk2 brain.

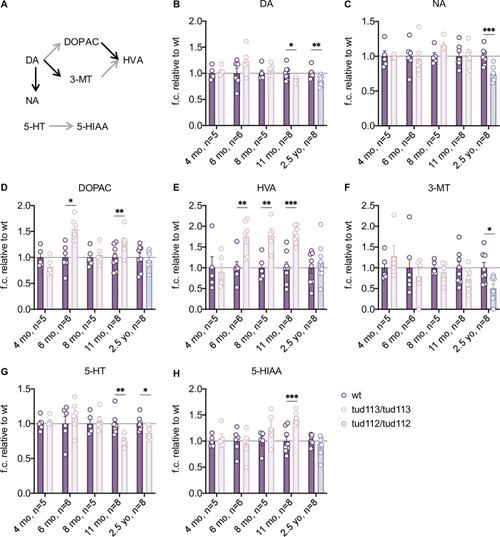
(A) Simplified scheme of the catabolism of dopamine and serotonin in the zebrafish brain. Each arrow represents a distinct enzymatically-catalyzed step. Grey arrows indicate the reactions catalyzed by the combined action of monoamine oxidase (MAO)/aldehyde dehydrogenase. Abbreviations: 3-MT, 3-methoxytyramine; 5-HIAA, 5-hydroxyindoleacetic acid; 5-HT, serotonin; DA, dopamine; DOPA, 3,4-dihydroxyphenylacetic acid; HVA, homovanillic acid; NA, noradrenalin. (B-H) Levels of biogenic amines and their catabolites in the brain of adult maternal-zygotic tud113 fish at different ages: 4, 6, 8, and 11 months, and age-matched controls; data from 2.5-year-old (yo) maternal-zygotic tud112 fish, and age-matched controls, are also included. Plots represent means ± s.e.m. Statistical analyses: (B: 4–6 mo, B: 11 mo, C: 6 mo, C: 11 mo, C: 2.5 yo, D-G: 6–11 mo, G: 2.5 yo, H) two-tailed Student’s t-test; (B: 8 mo, B: 2.5 yo, C: 4 mo, C: 8 mo, G: 4 mo) two-tailed Mann-Whitney’s U-test.

Acknowledgments
This image is the copyrighted work of the attributed author or publisher, and ZFIN has permission only to display this image to its users. Additional permissions should be obtained from the applicable author or publisher of the image. Full text @ PLoS Genet.