
- Title
-
Renal and Extra Renal Manifestations in Adult Zebrafish Model of Cystinosis
- Authors
- Berlingerio, S.P., He, J., De Groef, L., Taeter, H., Norton, T., Baatsen, P., Cairoli, S., Goffredo, B., de Witte, P., van den Heuvel, L., Baelde, H.J., Levtchenko, E.
- Source
- Full text @ Int. J. Mol. Sci.
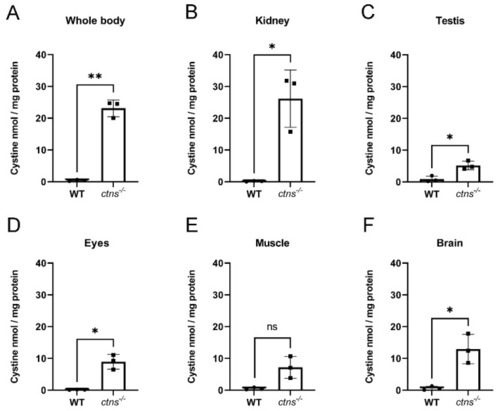
Cystine content in homogenates of wild-type and ctns−/− zebrafish. (A–F) Cystine content in whole body (A), kidney (B), testis (C), eyes (D), muscle (E) and brain (F) in wild-type and ctns−/− 18-month-old male zebrafish. Cystine concentration is expressed as nmol/mg protein. Each dot represents one zebrafish, for a total of n = 3 wild-type and n = 3 ctns−/− 18-month-old male zebrafish; unpaired t test with Welch’s correction, two tailed: * p < 0.05; ** p <0.01; ns: not significant. PHENOTYPE:
|
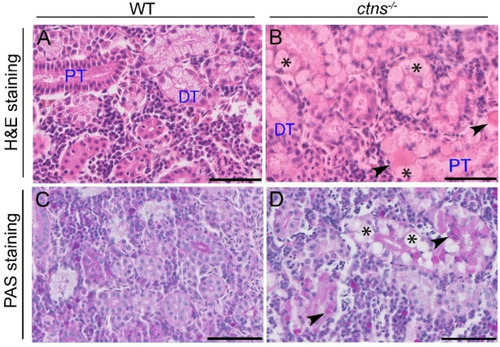
Kidney histology in wild-type and ctns−/− zebrafish. (A,B) Representative images of renal tubules of wild-type (A) and ctns−/− (B) 18-month-old zebrafish. Details of proximal tubules with hyaline-like eosinophilic droplets (black arrowheads) and cytoplasmic vacuoles (*). H&E staining. The scale bars represent 50 µm. (C,D) Representative images of the PAS staining of renal tubules of wild-type (C) and ctns−/− (D) 18-month-old zebrafish. Details of proximal tubules with hyaline-like droplets (black arrowheads) and cytoplasmic vacuoles (*). PAS staining. The scale bars represent 50 µm. PT: proximal tubule; DT: distal tubule. PHENOTYPE:
|
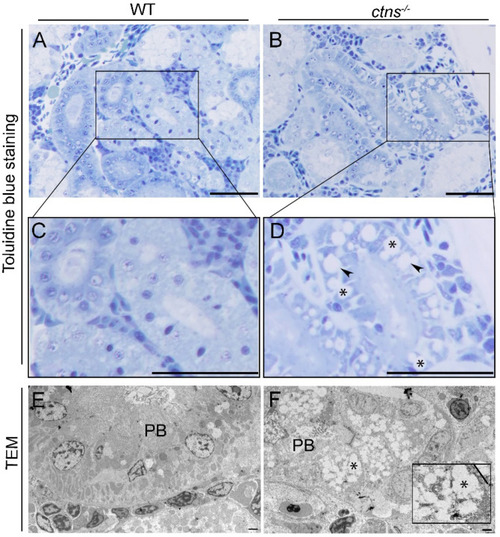
Kidney cystine crystals in wild-type and ctns−/− zebrafish PTECs. (A,B) Representative toluidine blue-stained images of renal proximal tubules in wild-type (A) and ctns−/− (B) 18-month-old zebrafish. The scale bars represent 50 µm. (C,D) Figure 3C,D show a higher magnification of Figure 3A,B. Details of renal proximal tubules with cytoplasmic vacuoles ((D); *), rectangular and polymorphous vacuolar spaces ((D); black arrowheads). (E,F) Representative TEM images of the renal proximal tubule of wild-type (E) and ctns−/− 18-month-old zebrafish (F). (F) Partial loss of proximal tubule brush borders (PB) and accumulation of the rectangular and polymorphous vacuoles (*) were observed in the renal proximal tubule of ctns−/− zebrafish. The high-magnification view of the rectangle in the bottom right corner shows the polymorphous vacuoles and a large vacuole with straight membrane border segments (a straight line). The scale bars represent 5 µm. PHENOTYPE:
|

Glomerular morphology in wild-type and in |
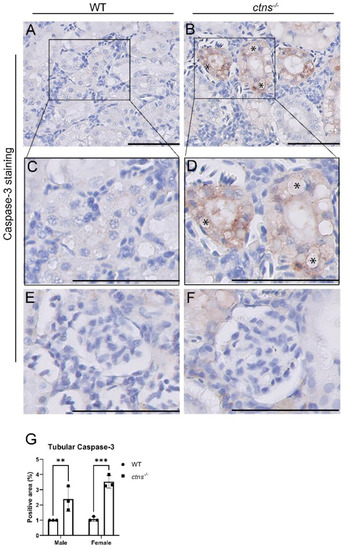
Increased apoptosis in PTECs with vacuoles in ctns−/− zebrafish. (A,B) Representative images of the cleaved caspase-3 immunostaining of tubules of wild-type (A) and ctns−/− (B) 18-month-old zebrafish. The scale bars represent 50 µm. (C,D) The bottom panels show a higher magnification of the boxed areas in the upper panels. Details of PTECs with cytoplasmic vacuoles (*). The scale bars represent 50 µm. (E,F) Representative images of the cleaved caspase-3 immunostaining of glomerulus of wild-type (E) and ctns−/− (F) 18-month-old zebrafish. The scale bars represent 50 µm. (G) The quantification of the tubular caspase-3 staining positive area in wild-type and ctns−/− zebrafish in both genders. Each dot represents one zebrafish, for a total of n = 3 wild-type and n = 3 ctns−/− 18-month-old zebrafish. Two-way ANOVA with Fisher’s least significant difference (PLSD) test: ** p < 0.01; *** p < 0.001. |
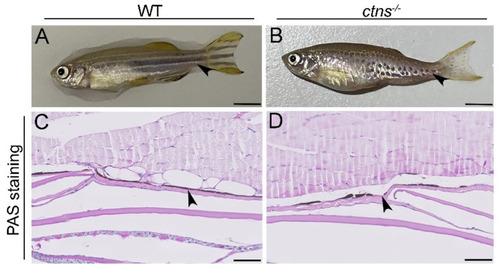
Hypopigmented spotted skin pattern in ctns−/− zebrafish. (A,B) Representative pictures of wild-type (A) and ctns−/− (B) 18-month-old zebrafish. The scale bars represent 0.5cm. The black arrowheads indicate the different striped skin patterns. (C,D) PAS-stained pictures of epidermis of wild-type (C) and ctns−/− (D) 18-month-old zebrafish. The black arrowheads highlight the melanin layer. The interruption in the melanin layer is present in ctns−/− (D) while it is absent in wild-type zebrafish (C). The scale bars represent 50 µm. PHENOTYPE:
|
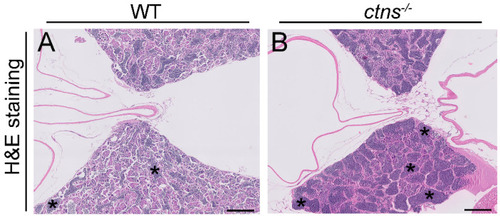
Spermatogenic cysts enriched in spermatozoa in ctns−/−zebrafish. (A,B) Representative H&E stained pictures of testis of wild-type (A) and ctns−/−(B) 18-month-old zebrafish. Dark blue and rounded staining represent the spermatozoa accumulated in the spermatogenic cysts (indicated with the asterisks). The scale bars represent 200 µm. PHENOTYPE:
|
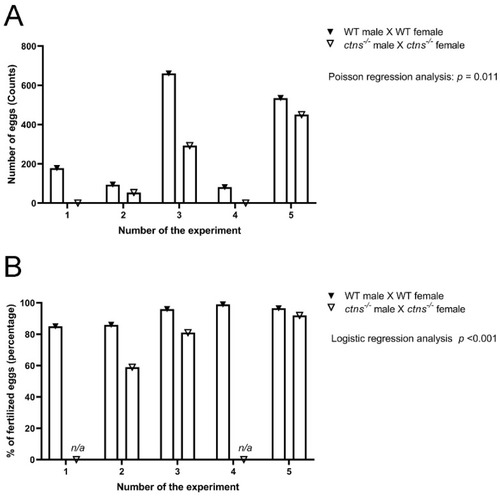
Egg production and percentage of fertilized eggs in wild-type and ctns−/−zebrafish. (A) Egg production was measured as a total number of eggs in wild type and ctns−/−zebrafish 18-month-old zebrafish. The egg production rate is 1.941 high in wild-type zebrafish compared with ctns−/−18-month-old zebrafish (rate ratio = 1.941); 95% CI (lower bound = 1.165, higher bound = 3.234); Poisson regression analysis; p = 0.011. (B) The percentage of fertilized eggs was measured on the total number of eggs. The odds of the fertilized eggs are 3.504 high in wild-type zebrafish compared with ctns−/−18-months-old zebrafish (odds ratio = 3.504); 95% CI (lower bound = 2.005, higher bound = 6.124); Logistic regression analysis; p < 0.001; n/a: not applicable. PHENOTYPE:
|
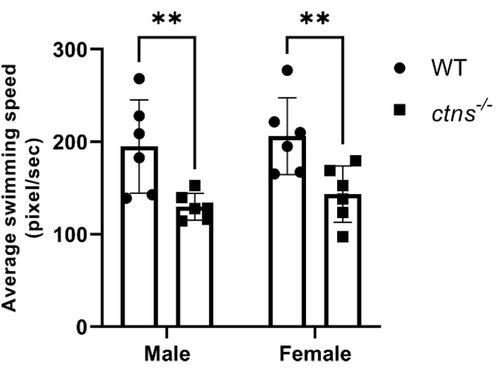
Average swimming speed in wild-type and ctns−/−zebrafish. The average speed is decreased in ctns−/−zebrafish compared with wild-type in both genders. The average swimming speed is measured in pixel/second. Each dot represents one zebrafish, for a total of n = 6 wild-type and n = 6 ctns−/−18-month-old zebrafish. Two-way ANOVA with Fisher’s least significant difference (PLSD) test: ** p < 0.01. PHENOTYPE:
|
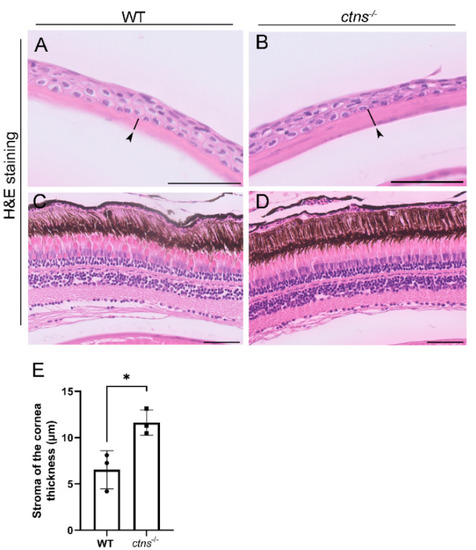
Eye histology in wild-type and ctns−/−zebrafish. (A,B) Representative images of cornea of wild-type (A) and ctns−/−(B) 18-month-old zebrafish. The stromal layer of the cornea (black arrowheads and black lines). H&E staining. The scale bars represent 50 µm. (C,D) Representative images of retina of wild-type (A) and ctns−/−(B) zebrafish. H&E staining. The scale bars represent 50 µm. (E) Relative quantification of the thickness of the stromal layer of the cornea. Each dot represents one zebrafish, for a total of n = 3 wild-type and n = 3 ctns−/−18-month-old zebrafish. Unpaired t test with Welch’s correction, two tailed: * p < 0.05. PHENOTYPE:
|