
|
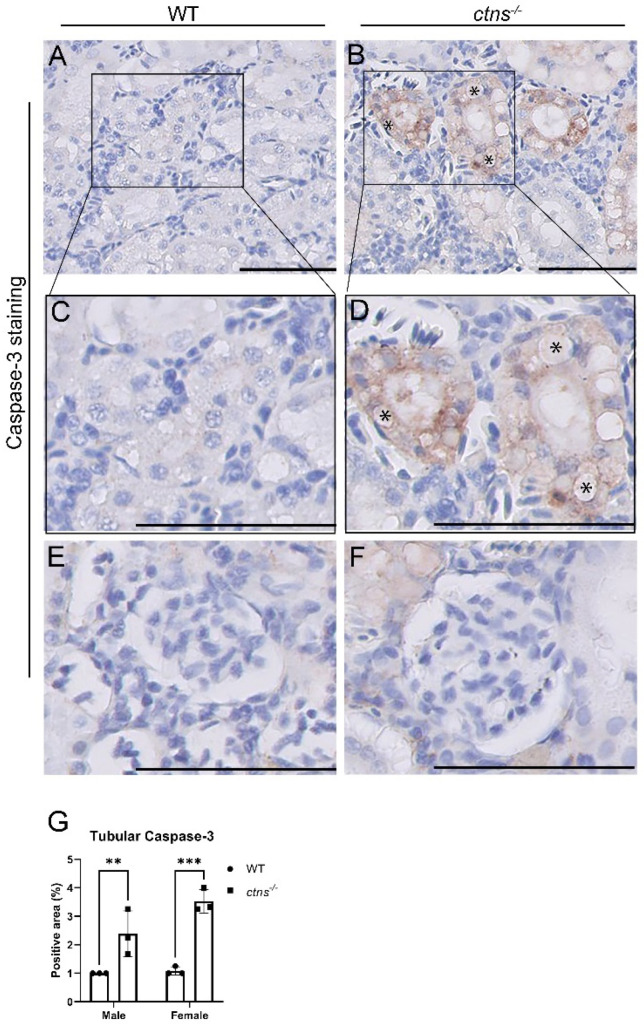
Figure 5
Increased apoptosis in PTECs with vacuoles in ctns−/− zebrafish. (A,B) Representative images of the cleaved caspase-3 immunostaining of tubules of wild-type (A) and ctns−/− (B) 18-month-old zebrafish. The scale bars represent 50 µm. (C,D) The bottom panels show a higher magnification of the boxed areas in the upper panels. Details of PTECs with cytoplasmic vacuoles (*). The scale bars represent 50 µm. (E,F) Representative images of the cleaved caspase-3 immunostaining of glomerulus of wild-type (E) and ctns−/− (F) 18-month-old zebrafish. The scale bars represent 50 µm. (G) The quantification of the tubular caspase-3 staining positive area in wild-type and ctns−/− zebrafish in both genders. Each dot represents one zebrafish, for a total of n = 3 wild-type and n = 3 ctns−/− 18-month-old zebrafish. Two-way ANOVA with Fisher’s least significant difference (PLSD) test: ** p < 0.01; *** p < 0.001.