FIGURE SUMMARY
Title

Tools to Image Germplasm Dynamics During Early Zebrafish Development

Authors
Zaucker, A., Mitchell, C.A., Coker, H.L.E., Sampath, K.
Source
Full text @ Front Cell Dev Biol

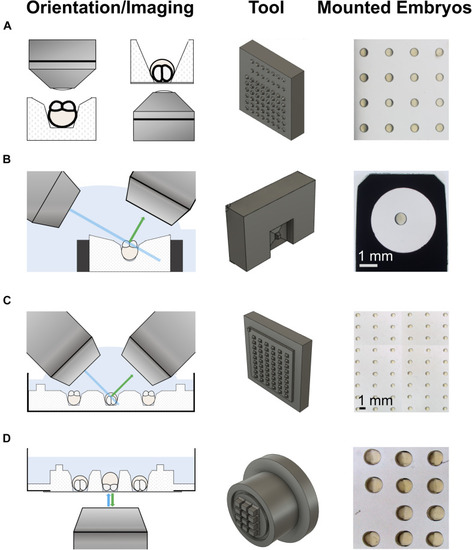
3d-printed tools for imaging on upright and inverted microscopes. The left column shows schematics of the different imaging modalities. The middle column shows the 3d-printed mounting tools. The right column shows examples of embryos mounted using the tools. (A) An iterative design strategy was used to optimize pins on 3d-printed mounting tools for different imaging modalities on upright (left) and inverted (right) microscopes. (B) Tool to mount embryos in a holder used for imaging on a lattice light-sheet microscope (LLSM). (C) Tool to mount embryos in a Petri dish for imaging on an upright microscope, such as a diSPIM. The pins sit on a plate with a slight offset from the actual tool block. This generates a shallow pool on the imaging plate after removal of the medium, allowing direct access for water dipping lenses to image the mounted embryos. (D) Tool to mount embryos in a glass-bottom dish for imaging on an inverted microscope, e.g., by spinning disk microscopy. Similar to the tool for Petri dishes, this tool has a feature to produce shallow wells for mounting, a trench that runs around the wells.

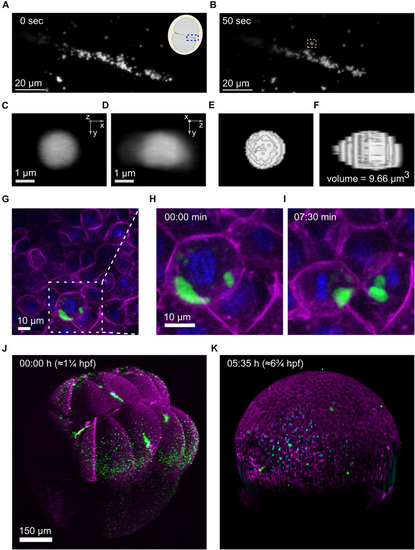
Imaging of germplasm across scales (A–F), Imaging of individual germ granules (RNP complexes). (A,B), Stills from a 4d movie showing germplasm aggregation at the first cleavage furrow imaged on a 3i LLSM at two time points 50 seconds apart. The inset in the top right corner of the earlier time point (A) is a schematic illustrating the area that has been imaged in an animal pole view first cleavage embryo, highlighted by a blue box. One specific germ granule is framed in an orange box at the later time point (B). (C–F), This germ granule (at 31 s) was used for volume measurement by threshold segmentation in 3d. (C,D), The granule is shown in two orthogonal views. (E,F), The segmented granule in the same views, together with the measured volume. (G–I), Imaging of individual PGCs. (G) Still from a 4d movie of germplasm segregation during cell division of a PGC at the oblong stage, imaged on a spinning disk confocal microscope. Germplasm is labeled by Buc-EGFP (green), membranes by Farnesyl-mCherry (magenta) and chromatin by H2Afv-tagBFP (blue). The middle and right panels show zoom-ins of the area highlighted by a dashed white box in (G) at the timepoints in (H) and (I). (J,K) In toto imaging of germplasm in a zebrafish embryo over a 5.5 h duration on a 3i diSPIM microscope in SPIM mode. The first frame (8-cell, left) and the last frame (gastrula, right) are shown. Four large germplasm masses are observed at the 8-cell stage (J) and are partitioned into many PGCs in the gastrula (K). Germplasm is labeled by Buc-EGFP (green), membranes and actin cortex by Farnesyl-mCherry and Utrn-mCherry (magenta), respectively, and chromatin by H2Afv-tagBFP (blue).

Acknowledgments
This image is the copyrighted work of the attributed author or publisher, and ZFIN has permission only to display this image to its users. Additional permissions should be obtained from the applicable author or publisher of the image. Full text @ Front Cell Dev Biol