FIGURE SUMMARY
Title

Glutamate 73 Promotes Anti-arrhythmic Effects of Voltage-Dependent Anion Channel Through Regulation of Mitochondrial Ca2+ Uptake

Authors
Shimizu, H., Huber, S., Langenbacher, A.D., Crisman, L., Huang, J., Wang, K., Wilting, F., Gudermann, T., Schredelseker, J., Chen, J.N.
Source
Full text @ Front. Physiol.

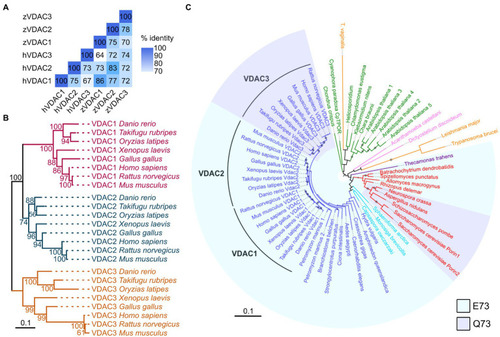
VDACs are highly conserved proteins. (A) Pairwise comparison of sequence identity of human (h) and zebrafish (z) VDAC protein sequences. (B) Maximum likelihood phylogenetic analysis of 24 vertebrate VDAC proteins. Branches are colored based on VDAC gene families (VDAC1: magenta, VDAC2: blue, and VDAC3: gold). Nodes are labeled with bootstrap values in units of percentage. The scale bar for branch lengths indicates the mean number of inferred substitutions per site. (C) Maximum likelihood phylogenetic analysis of 63 VDAC homologs from 41 species. Branches and labels are colored based on phylogenetic groupings of species: blue – animals, light blue – Holozoa (excluding animals), red – fungi, purple – Apusomonadida, orange – Excavata, pink – Amoebozoa, and green – Archaeplastida. Clades are shaded to indicate if proteins contain glutamate (E, light blue) or glutamine (Q, light purple) at amino acid position 73 (with respect to human VDAC1) or are unshaded if this region of the protein lacks high homology with human VDAC1. The size of circles on branches represents bootstrap values and is only displayed for values of 50% and greater. The scale bar for branch lengths indicates the mean number of inferred substitutions per site.

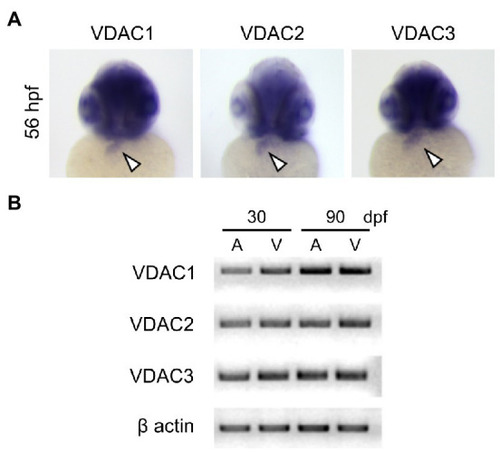
Expression of VDAC isoforms during zebrafish embryonic development. (A) Whole-mount in situ hybridization analysis using full-length riboprobes reveals that all VDAC isoforms are expressed in the embryonic heart (arrowheads). (B) RT-PCR analysis of VDAC mRNA from zebrafish hearts at 30 and 90 days post-fertilization (dpf). Expression of all VDAC isoforms is maintained to adulthood in both the atrium (A) and the ventricle (V).

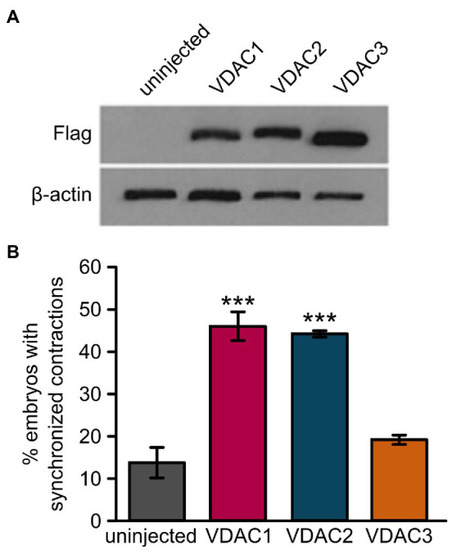
Overexpression of VDAC1 or VDAC2 but not VDAC3 restores rhythmic cardiac contractions in tremblor/ncx1h mutants. (A) Western blot with anti-FLAG antibody after SDS-PAGE with lysate from 32 hpf uninjected embryos or embryos injected with 25 pg. of C-terminally FLAG-tagged VDAC mRNA demonstrates that all VDAC mRNAs are expressed at comparable levels in embryos. β-actin was used as a loading control. (B) While injection of 25 pg. VDAC1 or VDAC2 mRNA significantly restored rhythmic cardiac contractions in 1-day-old tremblor/ncx1h mutant embryos (46.5 ± 3.4%, N = 3, n = 120, and 44.8 ± 0.4%, N = 3, n = 134, respectively, as opposed to 14 ± 3.5%, N = 3, n = 175 in uninjected siblings), injection of 25 pg. VDAC3 failed to recapitulate this effect (19.4 ± 1.1%, N = 3, n = 114). Overall rescue percentages represent the mean rescue percentage ± s.e.m. from N independent experiments, using a total of n embryos.

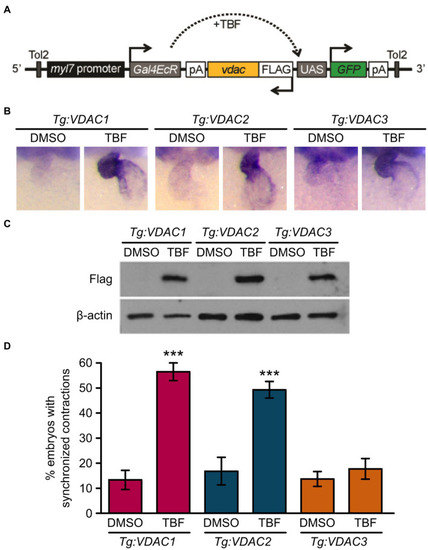
Induction of VDAC1 and VDAC2 but not VDAC3 expression restores rhythmic cardiac contraction in transgenic tremblor/ncx1h lines. (A) Schematic diagram of VDAC transgenic construct. The cardiomyocytes-specific promoter myl7 drives Gal4-ecdysone receptor fusion protein (Gal4EcR), which becomes transcriptionally activated in response to tebufenozide (TBF), an ecdysone receptor agonist and binds to the upstream activating sequence (UAS), resulting in the simultaneous expression of both FLAG-tagged VDAC and EGFP. Transgenic lines were bred in the tremblor/ncx1h background. (B) Whole-mount in situ hybridization analysis demonstrating that VDAC expression is induced specifically in the heart upon TBF treatment in transgenic zebrafish (Tg:VDAC). Embryos were treated with either DMSO or TBF from 24 hpf until they were fixed for in situ hybridization at 48 hpf. (C) Western blotting of 32 hpf transgenic embryo lysate with an anti-FLAG antibody showing that VDAC protein expression is induced after embryos are treated with TBF. β-actin was used as a loading control. (D) While only 13.5 ± 3.6% of DMSO-treated Tg:VDAC1; tremblor/ncx1h embryos exhibit rhythmic cardiac contraction (N = 3, n = 233), 56.72 ± 3.5% of TBF-treated Tg:VDAC1; tremblor/ncx1h embryos established rhythmic contraction (N = 3, n = 238). Similarly, as opposed to only 16.8 ± 5.7% of DMSO-treated Tg:VDAC2; tremblor/ncx1h embryos (N = 3, n = 161), 49.6 ± 3.1% of TBF-treated Tg:VDAC2; tremblor/ncx1h embryos showed cardiac contraction (N = 3, n = 227). In contrast, the effect of TBF-induced overexpression is minimal in Tg:VDAC3; tremblor/ncx1h (13.7 ± 2.9%, N = 3, n = 283 in DMSO-treated embryos compared to 17.9 ± 4.0%, N = 3, n = 373 in TBF-treated embryos). Overall rescue percentages represent the mean rescue percentage ± s.e.m. from N independent experiments, using a total of n embryos.

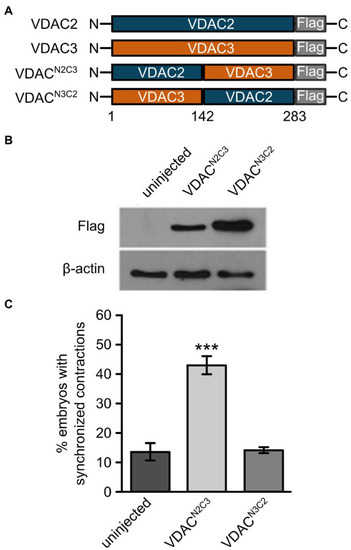
The N-terminal domain of VDAC2 contains critical elements for its cardioprotective activity. (A) Schematic representation of VDAC2/3 chimeric constructs. Reciprocal chimeric constructs were generated by swapping the N- and C-terminal halves of VDAC2 and VDAC3 and tagging a FLAG epitope at the C-terminal end. VDACN2C3: The N-terminal half of VDAC2 (amino acids 1 to 142) was fused to the C-terminal half of VDAC3. VDACN3C2: The N-terminal half of VDAC3 was fused to the C-terminal half of VDAC2. (B) Western blot with anti-FLAG antibody after SDS-PAGE with lysates from 30 hpf uninjected embryos or embryos injected with 60 pg. FLAG-tagged chimeric VDAC mRNA. β-actin was used as a loading control. (C) Injection of VDACN2C3 mRNA restored synchronized cardiac contractions in 1-day-old tremblor/ncx1h embryos (43.4 ± 2.8%, N = 3, n = 168 compared to 13.7 ± 3.1%, N = 3, n = 156 in uninjected siblings), whereas injection of VDACN3C2 mRNA fails to produce this effect (14.2 ± 1.2%, N = 3, n = 162). Overall rescue percentages represent the mean rescue percentage ± s.e.m. from N independent experiments, using a total of n embryos.

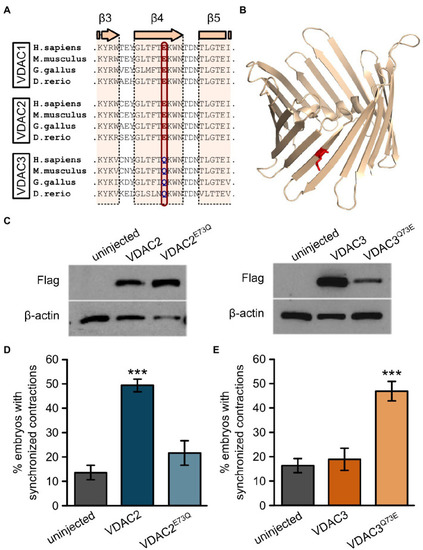
Figure 6. E73 is the critical amino acid residue that determines the ability of VDAC2 to suppress cardiac fibrillation in the tremblor/ncx1h mutant. (A) Alignment of protein sequences of VDAC1, 2, and 3 from different species. In all the species examined the position corresponding to zebrafish residue 73 is consistently occupied by a glutamate (E) in VDAC1 and VDAC2, whereas this position is occupied by glutamine (Q) in VDAC3. (B) Three-dimensional model of the VDAC2 protein (pdb: 4bum) showing the location of amino acid 73 in β-sheet 4 in red. (C) Western blot analysis of lysates from 30 hpf uninjected embryos or embryos injected with 25 pg. FLAG-tagged wild type and point mutant VDAC mRNA. β-actin was used as a loading control. (D) Mutation of E73 to Q in VDAC2 abrogates its ability to suppress cardiac fibrillation in tremblor/ncx1h mutants (49.7 ± 2.8%, N = 3, n = 144 with VDAC2 in contrast to 21.7 ± 5.1%, N = 3, n = 155 with VDAC2E73Q). (E) Vice-versa, by mutating Q73 to E, VDAC3 gained the ability to restore rhythmic cardiac contraction in tre mutants (19.0 ± 4.4%, N = 3, n = 182 with VDAC3 in contrast to 47.2 ± 4.3%, N = 3, n = 145 with VDAC3Q73E). Overall rescue percentages represent the mean rescue percentage ± s.e.m. from N independent experiments, using a total of n embryos.

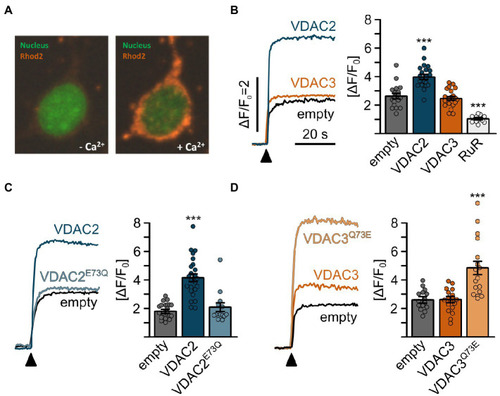
Mitochondrial Ca2+ uptake in HeLa cells is promoted by E73. (A) Representative confocal images of permeabilized HeLa cells loaded with Rhod2 after transiently transfection with VDAC expression constructs. Mitochondrial Rhod2 fluorescence is minimal at the basal state (left). Upon addition of Ca2+, the Rhod2 fluorescence rapidly concentrates in mitochondria (right). (B-D) Mitochondrial Ca2+ uptake assays of HeLa cells transiently transfected with VDAC constructs; (B) mitochondrial Ca2+ uptake was observed in empty vector transfected control cells (empty, ∆F/F0 = 2.64 ± 0.82, n = 18), which was significantly enhanced by overexpression of VDAC2 (∆F/F0 = 3.99 ± 0.80, n = 22) but not VDAC3 (∆F/F0 = 2.47 ± 0.61, n = 22) and significantly inhibited by ruthenium red (∆F/F0 = 1.06 ± 0.23, n = 12). (C) While wild-type VDAC2 enhanced mitochondrial Ca2+ uptake (∆F/F0 = 1.83 ± 0.52 for empty cells vs. ∆F/F0 = 4.18 ± 1.4 for VDAC2, n = 22 and 24, respectively), VDAC2E73Q failed to induce this effect (∆F/F0 = 2.09 ± 1.15, n = 13). (D) Conversely, wild-type VDAC3 did not induce a significant increase in mitochondrial Ca2+ uptake (∆F/F0 = 2.63 ± 0.70 for empty cells vs. ∆F/F0 = 2.59 ± 0.81 for VDAC3, n = 15 and 18, respectively); however, VDAC3Q73E significantly increased mitochondrial Ca2+ uptake to ∆F/F0 = 4.85 ± 1.99 (n = 18).

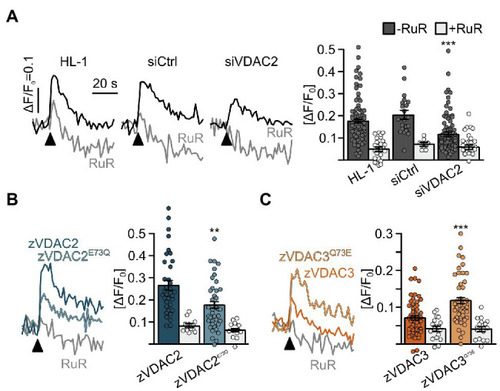
Figure 8. Restoration of SR-mitochondria Ca2+ transfer in permeabilized HL-1 cardiomyocytes. (A) Knockdown of the endogenous mVDAC2 in HL-1 cells significantly reduced SR-mitochondria Ca2+ transfer after addition of caffeine (arrowhead) from ΔF/F0 = 0.18 ± 0.01 (n = 84) to 0.12 ± 0.01 (n = 83) while a scrambled siRNA control did not affect Ca2+ transfer (0.20 ± 0.02, n = 21). (B) Wild-type zVDAC2 restored mitochondrial Ca2+ uptake to 0.27 ± 0.02 (n = 36), well above mVDAC2 knockdown cells. Overexpression of zVDAC2E73Q restored mitochondrial Ca2+ uptake to only 0.18 ± 0.02 (n = 39), which is significantly lower compared to wild-type zVDAC2. (C) Conversely, zVDAC3 did not restore mitochondrial Ca2+ uptake in mVDAC2 knockdown cells (0.12 ± 0.01, n = 54), while VDAC3Q73E restored mitochondrial Ca2+ uptake to ΔF/F0 = 0.20 ± 0.02, (n = 50). Arrowheads indicate injection of 10 mM caffeine. Statistical analysis was performed using Kruskal-Wallis test with Dunn’s post-hoc test.

Acknowledgments
This image is the copyrighted work of the attributed author or publisher, and ZFIN has permission only to display this image to its users. Additional permissions should be obtained from the applicable author or publisher of the image. Full text @ Front. Physiol.