IMAGE

Figure 1

ID
ZDB-IMAGE-210908-9
Source
Figures for Shimizu et al., 2021
Image
Figure Caption

Figure 1

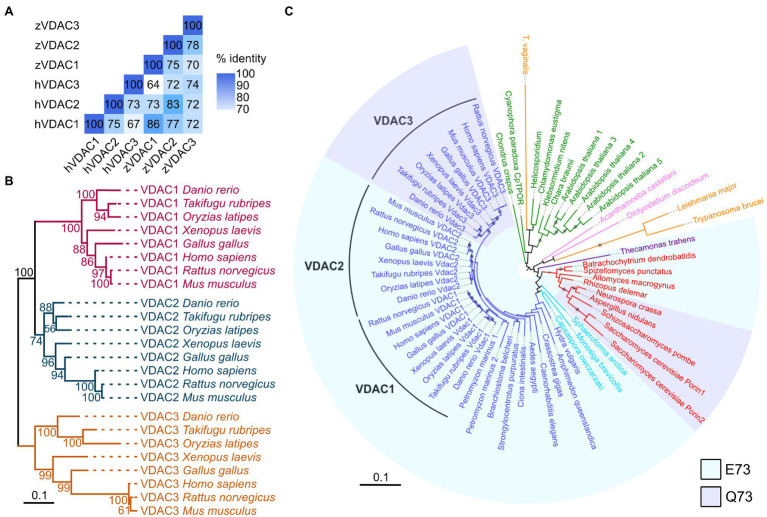
VDACs are highly conserved proteins. (A) Pairwise comparison of sequence identity of human (h) and zebrafish (z) VDAC protein sequences. (B) Maximum likelihood phylogenetic analysis of 24 vertebrate VDAC proteins. Branches are colored based on VDAC gene families (VDAC1: magenta, VDAC2: blue, and VDAC3: gold). Nodes are labeled with bootstrap values in units of percentage. The scale bar for branch lengths indicates the mean number of inferred substitutions per site. (C) Maximum likelihood phylogenetic analysis of 63 VDAC homologs from 41 species. Branches and labels are colored based on phylogenetic groupings of species: blue – animals, light blue – Holozoa (excluding animals), red – fungi, purple – Apusomonadida, orange – Excavata, pink – Amoebozoa, and green – Archaeplastida. Clades are shaded to indicate if proteins contain glutamate (E, light blue) or glutamine (Q, light purple) at amino acid position 73 (with respect to human VDAC1) or are unshaded if this region of the protein lacks high homology with human VDAC1. The size of circles on branches represents bootstrap values and is only displayed for values of 50% and greater. The scale bar for branch lengths indicates the mean number of inferred substitutions per site.

Acknowledgments
This image is the copyrighted work of the attributed author or publisher, and ZFIN has permission only to display this image to its users. Additional permissions should be obtained from the applicable author or publisher of the image. Full text @ Front. Physiol.